
LinkedIn Impressions vs Reach: What the Numbers Mean (2026)
LinkedIn impressions vs reach explained: how LinkedIn counts each, why they differ, what a healthy ratio looks like, and how to grow both in 2026.
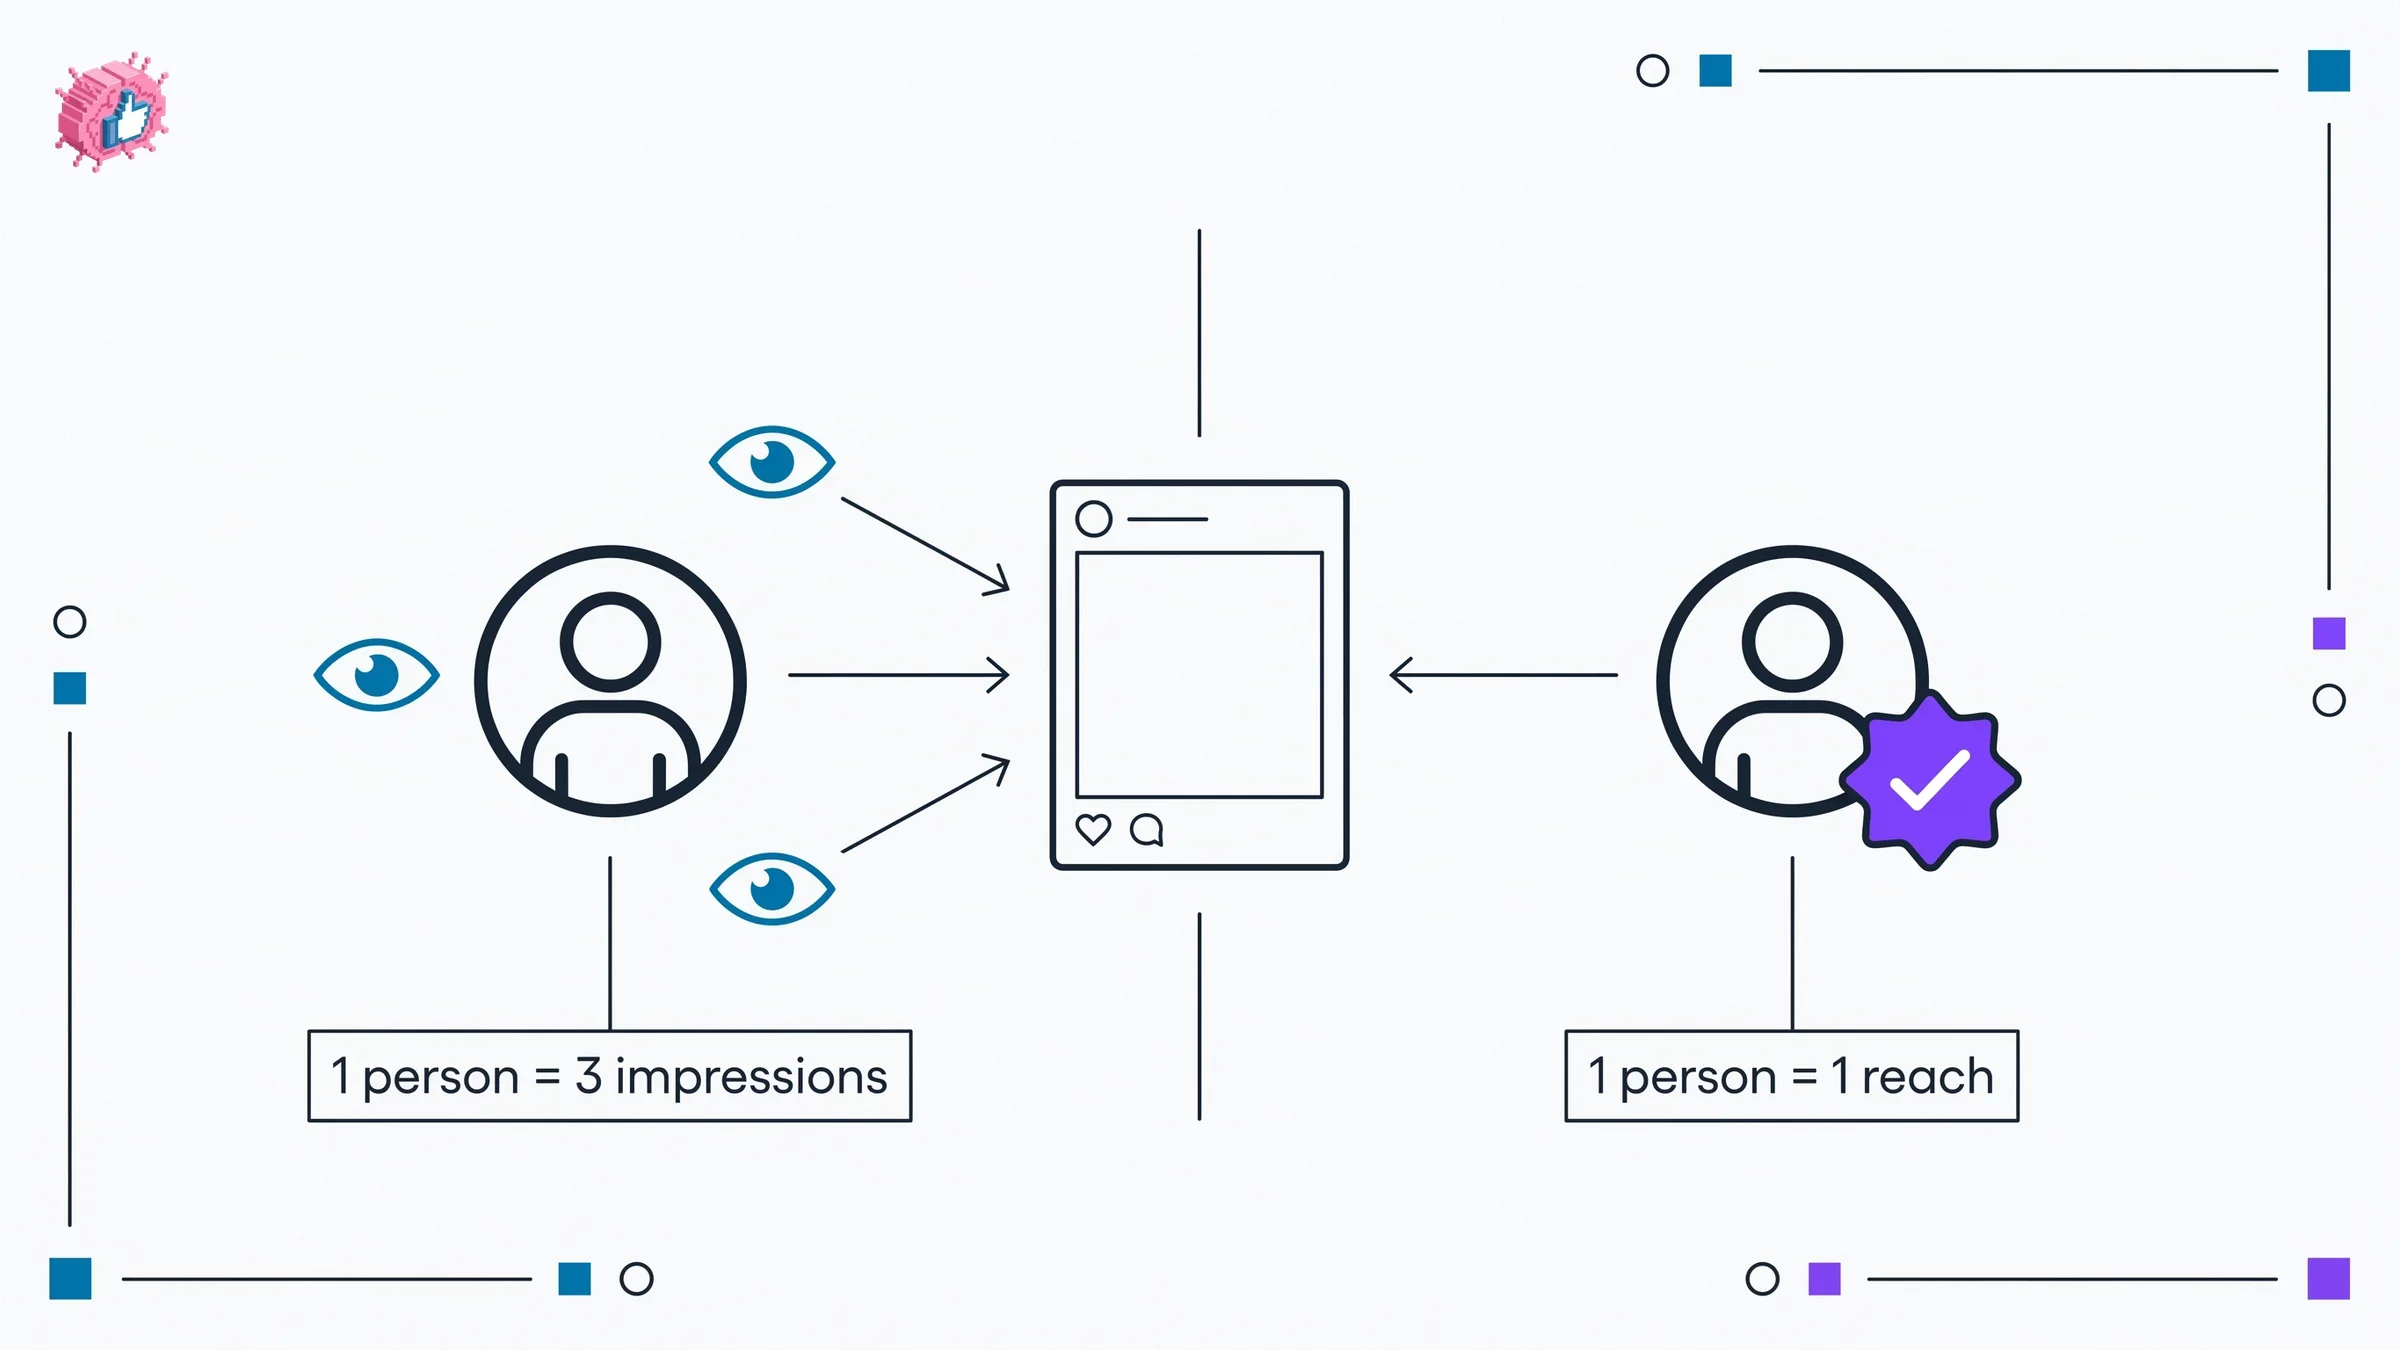
Open the analytics on any LinkedIn post and the first two numbers you see are impressions and reach, and most people treat them as the same thing. They are not. If your post is shown to 200 people but 60 of them see it twice, your reach is 200 and your impressions are 260. That gap is the whole story of how LinkedIn distributed your content.
Getting LinkedIn impressions vs reach right matters because the two numbers answer completely different questions. Impressions tell you how much total exposure your post earned. Reach tells you how many actual humans you got in front of. Confuse them and you will either celebrate vanity numbers or panic over healthy ones.
This guide breaks down exactly how LinkedIn counts each metric, why they diverge, what a healthy impressions-to-reach ratio looks like, and the specific levers that grow each one. The comparison table below is the fastest way to internalize the difference, and the rest fills in the why.
Automate your LinkedIn for 30 days
What are LinkedIn impressions?
Impressions are the total number of times your post was displayed on a screen, counted every single time it appears, even to the same person more than once.
LinkedIn counts an impression when your post is visible for at least 0.3 seconds in someone's feed. The same account scrolling past your post in the morning and again that evening generates two impressions. This is why impressions almost always run higher than reach.
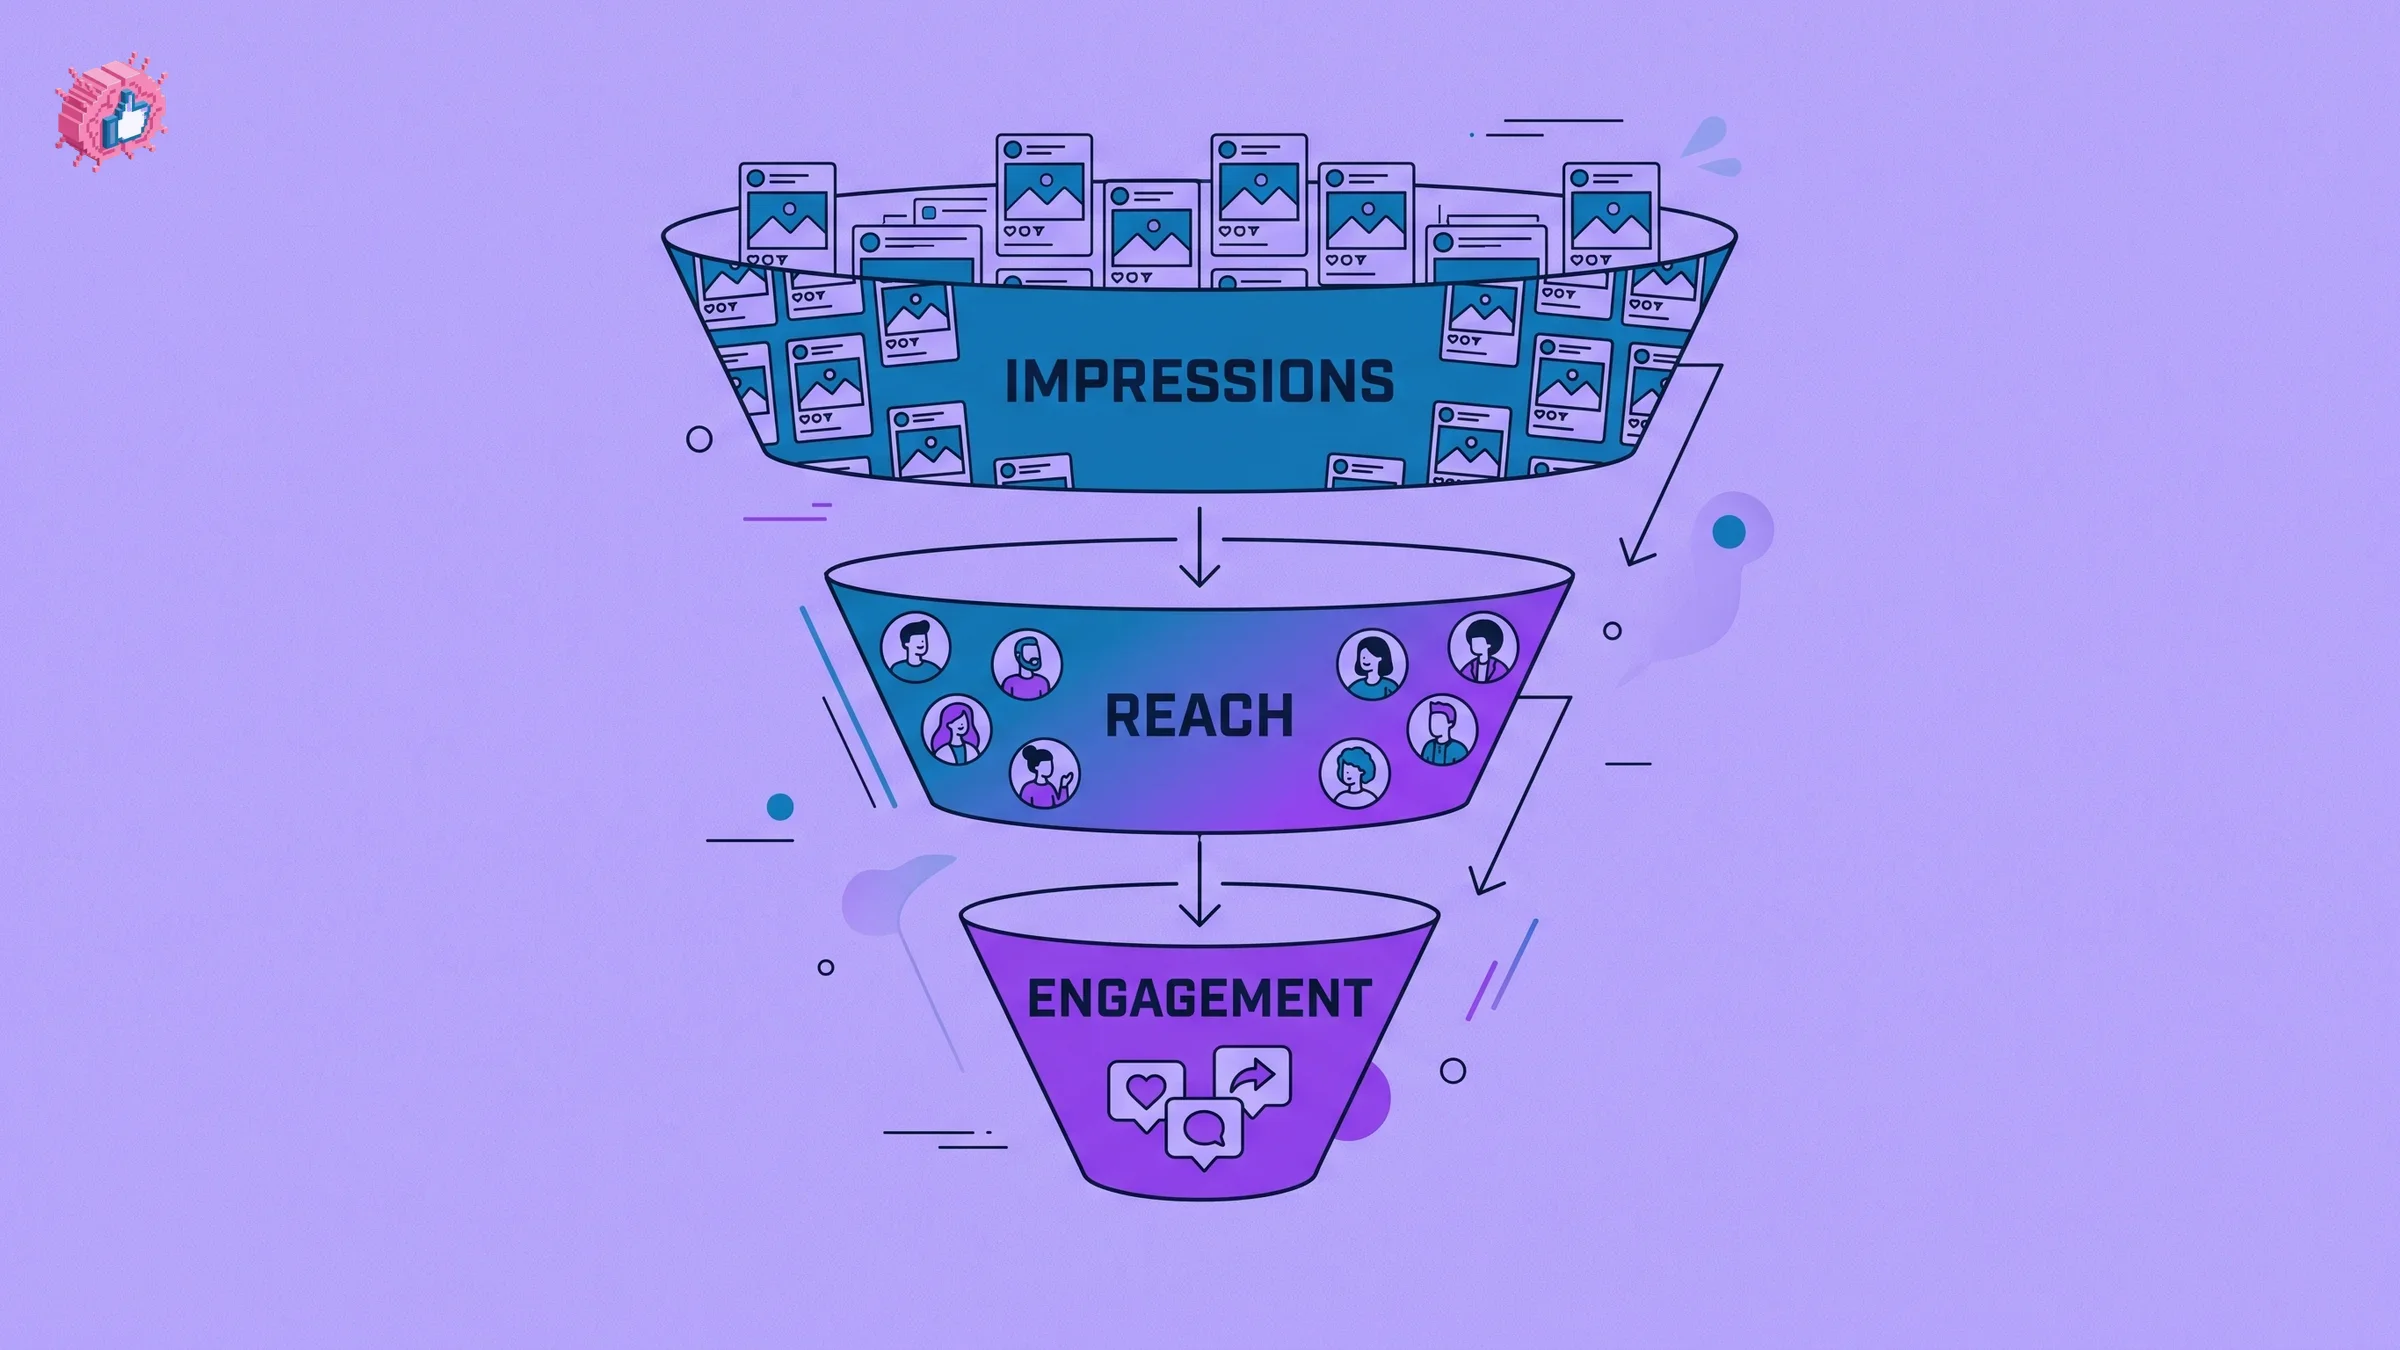
Impressions are the headline number LinkedIn shows under each post, and they are useful for one thing in particular: measuring total exposure and distribution momentum. When a post catches the algorithm and gets surfaced across multiple feed sessions, impressions climb fast. If you want to understand how that distribution actually works, the LinkedIn algorithm guide covers the ranking signals that decide how widely a post travels.
What impressions do not tell you:
- how many distinct people saw the post
- whether the same small audience saw it repeatedly
- how engaged those viewers were
What is LinkedIn reach?
Reach, sometimes labeled "unique views" or "members reached," is the number of distinct accounts that saw your post at least once. Each person is counted exactly one time no matter how often the post appeared in their feed.
Reach is the truer measure of audience size. It answers the question "how many real people did this post get in front of?" If you are trying to grow a following, generate leads, or build awareness, reach is closer to the outcome you actually care about than raw impressions.
LinkedIn shows reach inside the post analytics panel, not on the post surface. Click the view analytics button on your own post and you will see unique members reached alongside impressions. The LinkedIn engagement benchmarks tool can help you sanity-check whether your reach numbers are in a healthy range for your follower count.
LinkedIn impressions vs reach: the core difference
Here is the side-by-side breakdown of the two metrics so you can see exactly where they diverge.
| Dimension | Impressions | Reach |
|---|---|---|
| What it counts | Total times the post was displayed | Unique accounts that saw the post |
| Repeat views | Counted every time | Counted once per person |
| Where LinkedIn shows it | Below the post and in analytics | Inside post analytics panel only |
| Best for measuring | Total exposure, distribution momentum | True audience size |
| Always the higher number | Yes | No |
| Vanity risk | Higher (inflated by repeat views) | Lower (one count per human) |
| Tied to engagement rate | Yes, the standard denominator | Sometimes, depending on calculation |
The relationship is simple: impressions are always equal to or greater than reach. Reach can never exceed impressions because a person who saw the post once is counted once in reach but at least once in impressions.
Why impressions and reach differ
The gap between your impressions and reach is created by frequency, the average number of times each person saw your post. Divide impressions by reach and you get that frequency number.
A few patterns drive the difference:
- Strong distribution waves. When the algorithm surfaces your post across multiple sessions, the same people see it more than once. Impressions climb while reach stays flat.
- Engaged niche audiences. A small, tight audience that keeps returning to a post inflates impressions relative to reach. This is common for thoughtful posts that spark long comment threads.
- Comment-driven resurfacing. Every time someone comments, the post can re-enter the feeds of people who already saw it, adding impressions without adding reach.
None of these patterns are bad. A post with 5,000 impressions that reached 2,500 unique members, meaning each person saw it roughly twice, is completely normal and often a sign of healthy engagement. Understanding which posts trigger this resurfacing is part of how to go viral on LinkedIn, where repeat exposure compounds reach over days rather than minutes.
What is a healthy impressions-to-reach ratio?
The impressions-to-reach ratio (also called frequency) tells you how many times, on average, each person saw your post. You calculate it by dividing impressions by reach.
Here is how to read the result:
| Ratio | What it usually means |
|---|---|
| ~1.0 | Single distribution wave, no return visits, broad one-time reach |
| 1.5 to 2.0 | Healthy resurfacing, audience saw the post a second time |
| 2.0 to 3.0 | Engaged audience returning, often driven by comments |
| 3.0+ | Repeated feed sessions, small audience seeing it many times |
A ratio above 2.0 is not inherently a problem. According to public benchmark analysis, it often means a smaller audience is engaging deeply rather than your reach being limited. The number to watch is reach itself: if reach is low and the ratio is high, the algorithm is recycling the same people instead of expanding distribution.
As a rough baseline from public benchmarks, a healthy post reaches roughly 10 to 30 percent of your total follower count in organic impressions. So a page with 2,000 followers targeting 200 to 600 impressions per post is reasonable. Personal profiles often aim for 500 to 1,000 impressions per post, though this varies widely by niche and audience size.
Automate your LinkedIn for 30 days
How engagement rate connects to impressions and reach
Engagement rate is where impressions and reach stop being vanity numbers and start measuring quality. The most common formula, engagement rate by impressions, divides total engagements by impressions and multiplies by 100.
The 2026 benchmarks from public sources give you targets:
| Metric | 2026 benchmark | Source basis |
|---|---|---|
| Personal profile engagement rate | ~3.85% (by impressions) | Social benchmark reports |
| Company page engagement rate | ~2.1% | Social benchmark reports |
| "Good" engagement rate | 4% to 6% | Industry consensus |
| "Excellent" engagement rate | 6% to 10% | Industry consensus |
| Video post engagement rate | ~4.7% average | Format benchmark data |
Because engagement rate uses impressions as the denominator, a post with high impressions but low engagement signals that the algorithm distributed it widely but the content did not land. A post with lower impressions and high engagement is often the more valuable one. If you want to predict how a draft will perform before you post it, the viral score checker scores engagement potential, and the deeper mechanics live in the LinkedIn content strategy guide.
How to grow your LinkedIn reach
Reach grows when you get your content in front of more unique people. The levers:
- Strengthen your hook. The first two lines decide whether someone stops scrolling. A stronger opener lifts dwell time, which signals the algorithm to expand distribution to new people. Test openers with the LinkedIn hook generator.
- Post when your audience is active. Reaching unique people depends on catching them online. The best time to post on LinkedIn tool helps you find your windows.
- Drive early engagement. Comments and reactions in the first hour push your post into more feeds, expanding reach to second-degree connections.
- Write for shareability. Posts that get reshared reach entirely new networks. Frameworks that travel are covered in the how to write a LinkedIn post guide.
- Use the right format. Video and carousels often earn broader distribution. You can mock up how a post will look before publishing with the LinkedIn post preview.
How to grow your LinkedIn impressions
Impressions grow when your content earns repeat exposure and sustained distribution. The levers overlap with reach but lean toward longevity:
- Spark conversation, not just reactions. Comments resurface your post to people who already saw it, stacking impressions. Ask a genuine question in the post.
- Reply to every comment. Each reply re-triggers distribution and keeps the post alive in feeds for longer, adding impressions across more sessions.
- Build a consistent posting cadence. Regular posting trains the algorithm to surface your content faster, which lifts impressions over time. The LinkedIn content strategy guide covers cadence planning.
- Repurpose proven content. Topics that earned strong impressions before tend to do it again. Start from structures that work using viral post templates.
- Draft faster so you ship more. More high-quality posts means more chances at distribution. The LinkedIn post generator helps you turn ideas into drafts quickly.
What this means for you
- Check reach, not just impressions, before you judge a post. Impressions can be inflated by repeat views. Reach tells you the real audience size, and engagement rate tells you how well it landed.
- Calculate your impressions-to-reach ratio. A ratio near 1.0 means broad one-time exposure; 2.0 or higher means an engaged audience returning. Neither is automatically better, so read it alongside reach.
- Benchmark engagement rate against 4% to 6%. Use the LinkedIn engagement benchmarks tool to see where you stand, and treat anything above 5% as strong performance.
- Grow reach with hooks and timing; grow impressions with conversation and consistency. They respond to slightly different tactics, so optimize for the outcome you actually want.
- Test before you post. Score drafts with the viral score checker and start a free trial of ViralBrain to analyze your top creators and generate posts built to earn both reach and impressions.
Sources: Engage AI: LinkedIn Impressions vs Reach, Sprout Social: Reach vs Impressions, Socialinsider: LinkedIn Organic Benchmarks 2026, Taplio: LinkedIn Engagement Rate 2026, AuthoredUp: LinkedIn Impressions vs Views, LinkedIn analytics documentation (2026)
FAQ
What is the difference between LinkedIn impressions and reach?
Impressions count the total number of times your post was displayed, including repeat views by the same person. Reach counts the number of unique accounts that saw the post at least once. Impressions are always equal to or higher than reach.
What are LinkedIn impressions?
A LinkedIn impression is logged each time your post is visible on someone's screen for at least 0.3 seconds. The same person can generate multiple impressions by seeing your post more than once. It is the headline exposure number shown below each post.
What does LinkedIn reach mean?
Reach, also called unique views or members reached, is the number of distinct people who saw your post at least once. Each person is counted only one time regardless of how often the post appeared in their feed, making it the truer measure of audience size.
Why are my impressions higher than my reach?
Because the same people see your post more than once. Strong distribution waves, comment-driven resurfacing, and engaged niche audiences all cause repeat views. Dividing impressions by reach gives you the average number of times each person saw the post.
What is a good impressions-to-reach ratio on LinkedIn?
A ratio near 1.0 means a single broad distribution wave, while 1.5 to 2.0 indicates healthy resurfacing. A ratio above 2.0 often means a smaller audience is engaging deeply, which is not a problem as long as your total reach is healthy.
How is LinkedIn engagement rate calculated from impressions?
Engagement rate by impressions divides total engagements (reactions, comments, shares, clicks) by impressions, then multiplies by 100. Based on 2026 public benchmarks, around 3.85% is average for personal profiles, 4% to 6% is good, and above 6% is excellent.
Should I focus on impressions or reach?
Focus on reach and engagement rate for true growth outcomes like followers and leads, since impressions can be inflated by repeat views. Use impressions to gauge distribution momentum and how long a post stays active in feeds.
How do I grow both LinkedIn impressions and reach?
Grow reach with stronger hooks, better posting timing, and shareable formats. Grow impressions with conversation-driven posts, replying to comments, and consistent cadence. Tools like the LinkedIn post generator and LinkedIn hook generator help you produce content optimized for both.
Automate your LinkedIn for 30 days
ViralBrain plans, writes, and schedules your LinkedIn content — using official LinkedIn APIs so your account stays safe.
- Official LinkedIn APIs — no risk of ban
- You approve every post before it goes live
- Cancel anytime
Keep reading

Best 7 LinkedIn Analytics Tools in 2026
Compare the 7 best LinkedIn analytics tools in 2026. We review ViralBrain, Shield, Taplio Analytics, AuthoredUp, Sprout Social, Buffer Analyze, and LinkedIn native — features, pricing, and benchmarks.

What Is a Good LinkedIn Engagement Rate? 2026 Benchmarks
A good LinkedIn engagement rate in 2026 is 4-6% for personal profiles and 2-3% for company pages. See full benchmarks, tiers, and format data.
7 best LinkedIn marketing tools for 2026
Compare the 7 best LinkedIn marketing tools in 2026 for content, scheduling, analytics, and prospecting, with pricing, strengths, and who each fits.