
What Is a Good LinkedIn Engagement Rate? 2026 Benchmarks
A good LinkedIn engagement rate in 2026 is 4-6% for personal profiles and 2-3% for company pages. See full benchmarks, tiers, and format data.
If your last LinkedIn post pulled a 2.3% engagement rate, is that good, average, or about to get buried? In 2026, we have actual numbers.
We pulled the engagement rate of every post in our analytics dataset (14,095 posts from 968 active hero creators), bucketed them into five performance tiers, and cross-referenced the results against the public 2026 benchmarks from Socialinsider and Meet Lea. The "good" range is narrower at the top, wider at the bottom, and very different for personal profiles versus company pages.
This post defines what counts as a good LinkedIn engagement rate in 2026, shows the five tiers most posts fall into, breaks down rates by format and industry, and explains what the top 4% of posts are doing differently.
Automate your LinkedIn for 30 days
The short answer
A good LinkedIn engagement rate in 2026 is between 4% and 6% for personal profiles and 2% to 3% for company pages. Anything between 6% and 10% is excellent, and 10% or higher is exceptional, hit by roughly the top 4% of posts. The platform-wide average for personal profiles is 3.85% (Socialinsider, Q1 2026, up 44% year over year from 2024).
If you are tracking personal-profile content and your average engagement rate sits above 4%, you are outperforming the median creator. If you are running a company page and consistently hold above 2.1%, you are beating the brand-page baseline. Below those numbers means the algorithm is sending your content to fewer people in the first place, and the people who see it are scrolling past.
The rest of this article shows how to read those numbers in context, including the tier system we use internally to grade posts.
How LinkedIn calculates engagement (and what to actually measure)
There are two ways to read engagement on LinkedIn. Both are common, both get called "engagement rate," and they produce very different numbers. Pick the one that matches what you can actually measure.
Engagement rate by impressions (the industry-standard definition):
(reactions + comments + shares) / impressions × 100
This is what Socialinsider, Meet Lea, Richard van der Blom's annual algorithm research, and every major LinkedIn benchmark study uses. The catch: impressions are private to each creator's own analytics. LinkedIn shows them in the post analytics view 24 hours after publishing, but they are not exposed publicly. You can compute this for your own posts. You cannot compute it for anyone else's.
Engagement rate by reach-proxy (what public scrapers, including ViralBrain, can compute):
(weighted reactions + comments + shares) / author followers × 100
This uses the author's follower count as a proxy for the audience the post can reach. The numbers run higher than the impression-based version because followers are a smaller denominator than impressions on a viral post. The trade-off: this metric is comparable across posts and creators without needing private analytics access. Useful for relative benchmarking. Not directly comparable to the impression-based industry benchmarks below.
The benchmarks in the next section use the impression-based formula (from Socialinsider and the other cited third-party studies). The performance tiers later in the post use the follower-based formula (because that is the data we have for 14,095 posts across 968 creators). We flag the difference whenever it matters.
What about the "comments are 15x the weight of likes" claim? That is an algorithmic-distribution weight, not an engagement-rate weight. LinkedIn's ranking model boosts posts with high comment velocity, which affects how many people see the post in the first place. The engagement-rate math itself does not weight comments differently than reactions or shares. Both can be true: comments drive more reach, and once reach is set, every reaction, comment, and share counts equally in the engagement-rate denominator.
What are impressions on LinkedIn? An impression is counted every time your post appears on someone's screen, whether they stop to read or scroll past. Impressions are not the same as reach: reach measures unique users, while impressions count every appearance, so the same person can generate multiple impressions. LinkedIn shows impression counts in post analytics 24 hours after publishing.
Dwell time is the silent input. LinkedIn's 2026 algorithm rewards how long readers stay on a post, and that signal does not appear in either engagement-rate formula. Long-form posts (900 to 1,300 characters) and document posts generate the highest dwell times, which is why their engagement rates run multiples higher than short text posts.
If you only track reactions, you are missing 80% of the signal. Track comment-to-reaction ratio, share count, and dwell-friendly formats. For how the 2026 ranking model weights these signals, see our LinkedIn algorithm guide.
The 5 performance tiers (proprietary data from 14,095 posts)
We grade every post in our analytics dataset against an internal baseline. The baseline is the median engagement rate across the full corpus, and each tier represents a multiplier above or below that line. Here is what the tier distribution looks like across 14,095 posts from 968 active hero creators (snapshot May 2026).
These tier numbers use the follower-based formula introduced above: (weighted engagement / author followers) × 100. They are not directly comparable to the 4 to 6% "good" range from Socialinsider, which uses the impression-based formula on opt-in creator analytics. Use the tiers for relative benchmarking against the 14,095 other posts in our corpus. Use the impression-based industry benchmarks for the absolute "is my engagement above average" question on your own analytics.
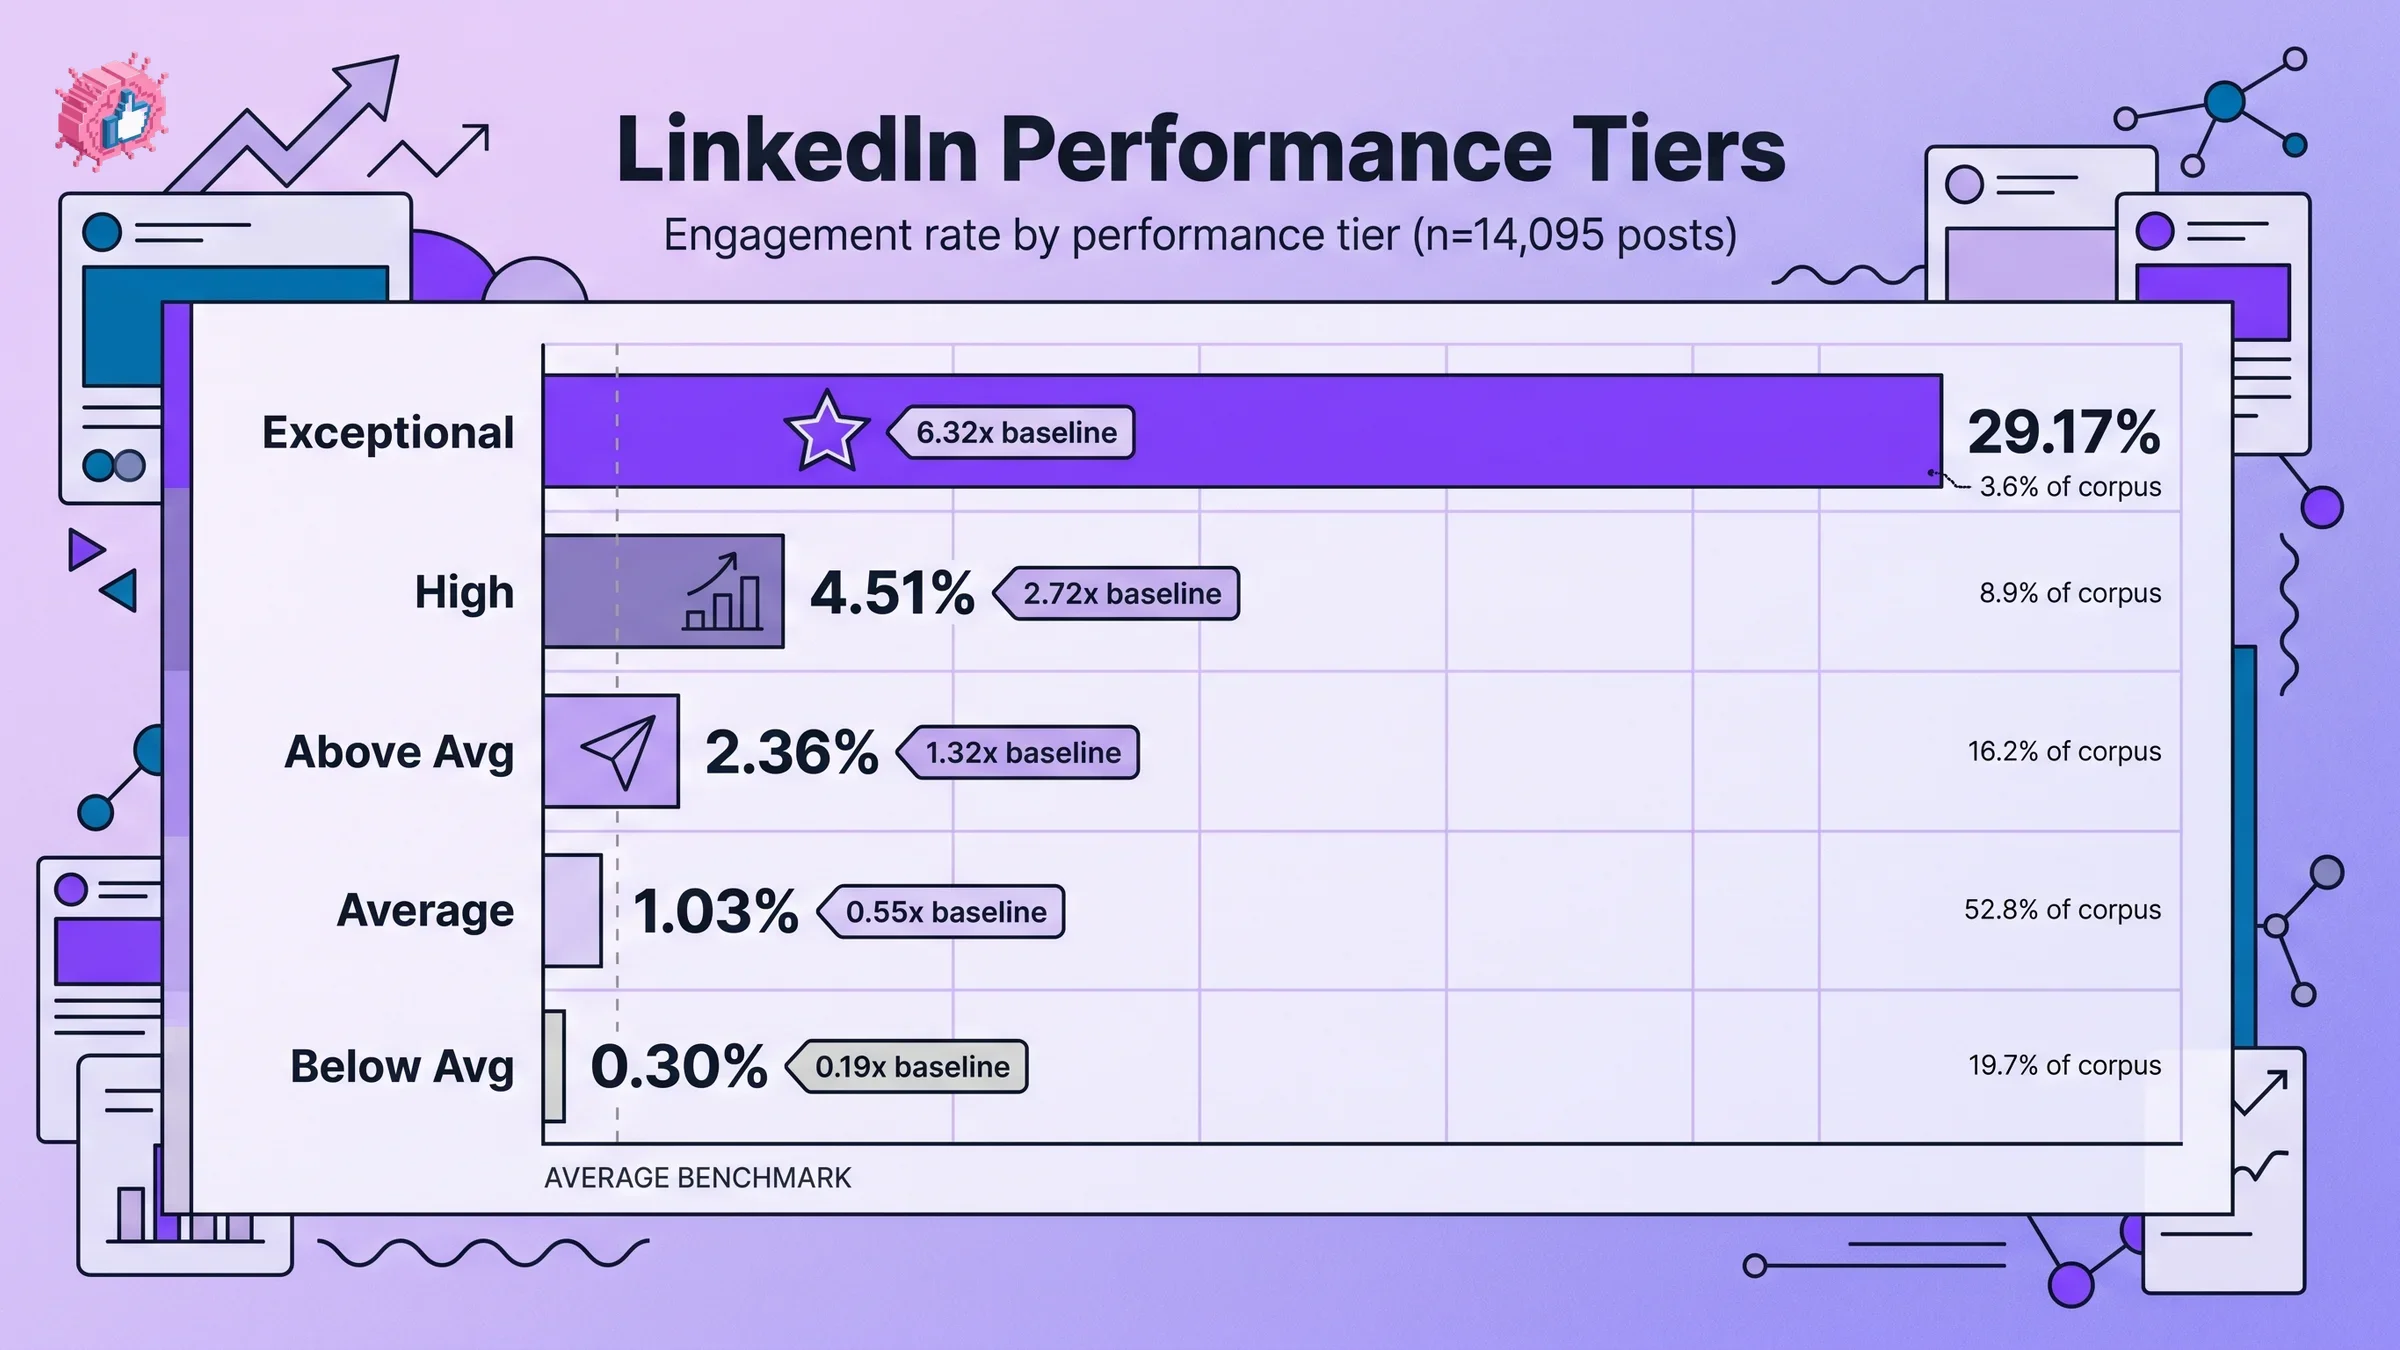
| Tier | Engagement rate | Multiplier vs baseline | % of corpus | Posts |
|---|---|---|---|---|
| EXCEPTIONAL | 29.17% | 6.32x | 3.6% | 504 |
| HIGH | 4.51% | 2.72x | 8.9% | 1,236 |
| ABOVE_AVG | 2.36% | 1.32x | 16.2% | 2,259 |
| AVERAGE | 1.03% | 0.55x | 52.8% | 7,354 |
| BELOW_AVG | 0.30% | 0.19x | 19.7% | 2,742 |
Source: ViralBrain analysis of 14,095 LinkedIn posts across 968 active hero creators, snapshot May 2026.
A few things jump out.
The middle is crowded, the top is rare. More than half of all posts (52.8%) cluster in the AVERAGE tier between roughly 0.5% and 1.5% engagement. That is the gravity well: most posts follow the safe, generic template that the algorithm rewards inconsistently.
The HIGH tier (4.51%) is what "good" actually looks like in our data. When public benchmarks say 4 to 6% is good for personal profiles, the corresponding tier in our dataset is HIGH, which only 8.9% of posts reach. Hitting that range puts you in the top 12% overall.
EXCEPTIONAL is a different game. The top 3.6% of posts hit 29.17%, 6.32 times the baseline. These are not lucky accidents. The distribution is highly skewed: a small number of posts capture a huge share of total engagement.
Below-average is more common than people admit. Nearly 1 in 5 posts (19.7%) lands in BELOW_AVG at 0.30% engagement or worse. Most are either too short (under 300 characters), poorly timed, or generic enough that the algorithm cannot find an audience for them. If your average sits here, the issue is structural.
The takeaway: do not benchmark your post against the AVERAGE tier. Compare to HIGH. That is the bar you actually want to clear.
Personal profiles vs company pages: why the gap exists
Personal profiles average 3.85% engagement. Company pages average 2.1%. The gap is real and has widened since 2023.
LinkedIn's 2026 algorithm shifted from a social-graph model (content from your network) to an interest-graph model (content the algorithm predicts you want). Personal profiles benefit because individual creators publish in a clear voice with consistent topics. Company pages tend to broadcast (product updates, hiring posts, generic thought leadership), which the algorithm reads as low-relevance.
A few other dynamics widen the gap:
- LinkedIn explicitly de-prioritizes company-page content in the feed in favor of personal-network signals
- Personal profiles allow conversational replies that look like authentic dialogue; company-page replies feel like marketing
- Comments on a personal post carry social proof in a way that company-page comments do not
What to do about it. If you run a company page, the highest-leverage move is amplifying employee posts (the "employee-generated content" or EGC strategy) rather than pumping more content into the brand page. The same content posted from a founder's personal profile will routinely outperform the company page version by 3 to 5 times.
For founders who want their personal profile to do the work the company page used to do, our viral post generator is trained on the personal-profile patterns that consistently land in the HIGH and EXCEPTIONAL tiers.
Engagement by format: where the leverage is
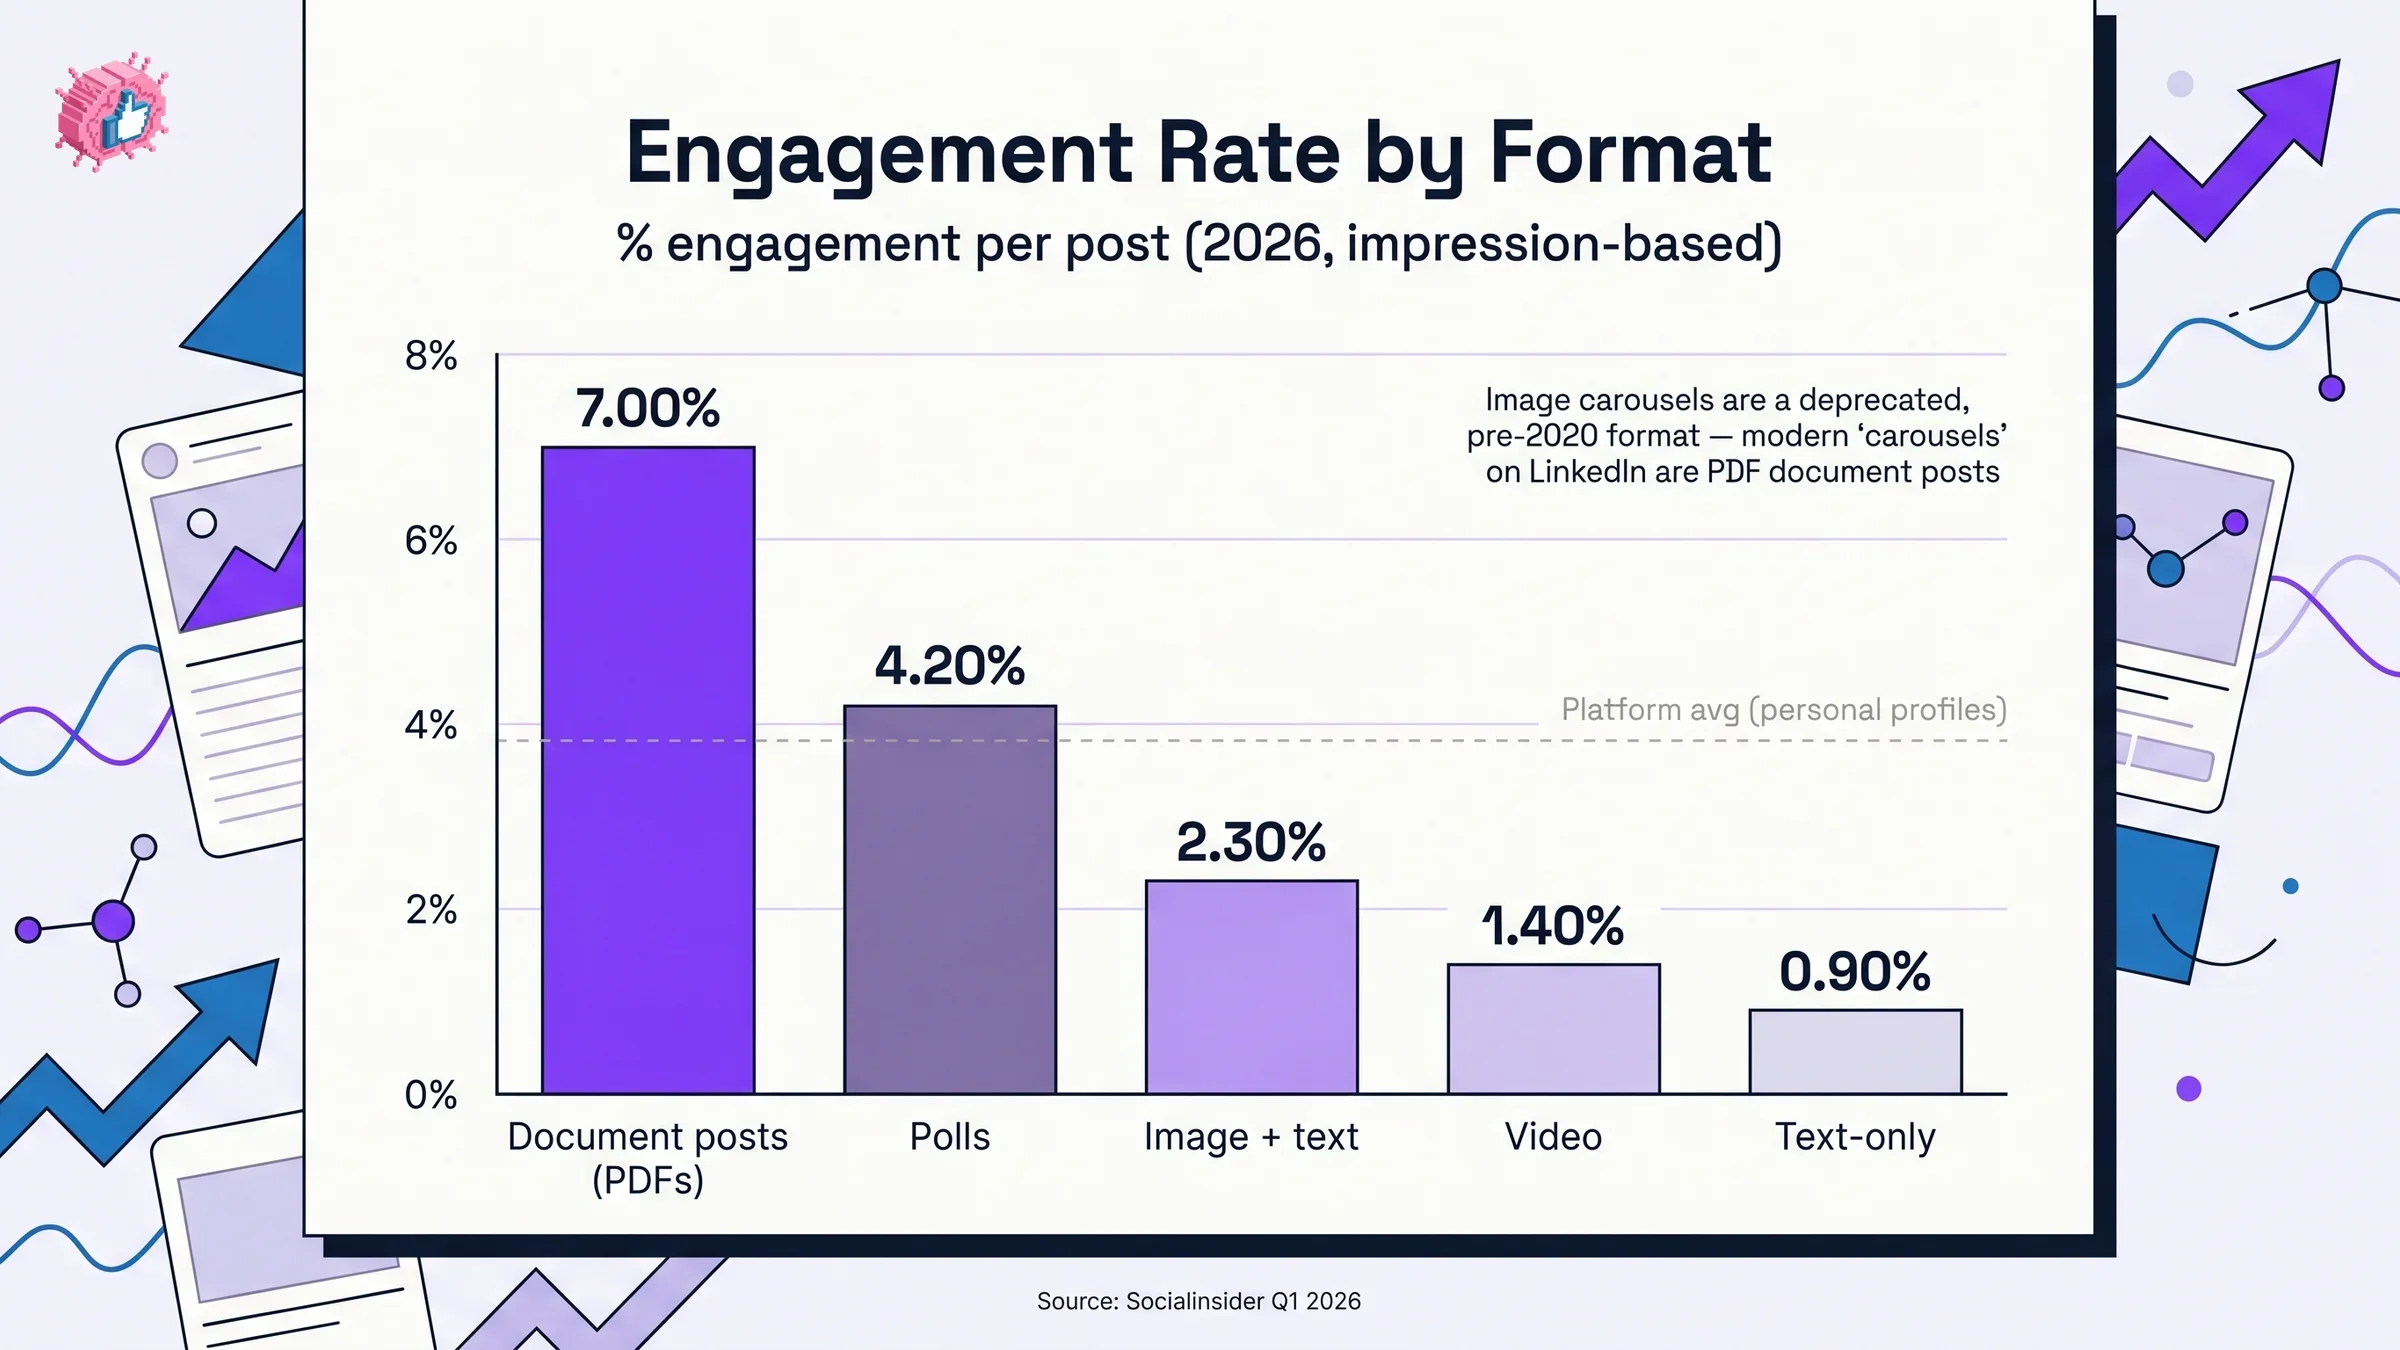
Not all post formats are equal in 2026. The gap between the highest-engagement format and the lowest is roughly 8 times, which dwarfs almost every other variable you can control.
| Format | Avg engagement rate | Notes |
|---|---|---|
| Document posts (PDFs, often called "carousels") | ~7% | By far the highest-performing organic format in 2026. When someone says "carousel" on LinkedIn they almost always mean this: a PDF uploaded as a document post and rendered as a swipeable slide deck. Long dwell time, swipe interaction signals strong attention. |
| Polls | 4.20% | Low effort, high comment rate. |
| Text-only with image | 2.30% | Mid-range default. |
| Video | 1.40% | Lower than expected. Dwell drops fast. |
| Text-only | 0.90% | Lowest baseline format. |
| Image carousels (multi-photo swipe) | deprecated | Largely a pre-2020 format. Some older benchmark data tags these as "carousels" alongside document posts, which can drag the reported "carousel" engagement rate down to roughly 6.6%. They are not a separate modern format in 2026. |
Source: Socialinsider Q1 2026 LinkedIn benchmarks.
Three numbers worth focusing on:
Document posts (PDFs) are the single highest-engagement format at roughly 7%. This is what most creators call a "carousel": a PDF uploaded as a document post and rendered as a swipeable slide deck. A reader who swipes through 8 slides signals deep attention, which boosts distribution. Document posts take longer to produce, which is why most creators avoid them. If you are not running document posts, you are leaving the easiest format-level lift on the table.
Video underperforms text-with-image. Video looks like a high-effort, high-engagement format, but in the 2026 algorithm, video dwell time is short (most viewers drop in the first 3 seconds) and the algorithm reads that as low signal. Video still works for narrative use cases, but it is not a default leverage move.
Text-only at 0.90% is the floor. A pure text post with no image, carousel, or document averages below 1% engagement. The EXCEPTIONAL tier still includes plenty of pure-text posts: text-only is the format with the highest variance, either landing hard or getting buried.
For why document posts and other dwell-time formats are winning right now, see our breakdown of how to go viral on LinkedIn.
Automate your LinkedIn for 30 days
Engagement by industry
Industry context matters because audience behavior varies. Here are the 2026 averages across the most-tracked industries.
| Industry | Avg engagement rate | Above/below platform avg |
|---|---|---|
| Marketing & Advertising | 4.80% | Above |
| Construction | 4.13% | Above |
| Education | 3.00% | Below |
| Manufacturing | 2.80% | Below |
| Financial Services | 2.65% | Below |
| Information Technology | 2.40% | Below |
| Healthcare | 2.20% | Below |
Source: Meet Lea 2026 industry benchmarks (multi-thousand-post sample).
Industries with higher creator density (marketing, advertising) and audiences trained to engage (construction, where personal-brand stories dominate) outperform. Risk-averse industries (financial services, healthcare) sit below the platform average even with strong content.
The takeaway is not "I am in healthcare so 2.2% is fine." It is the opposite: in lower-engagement industries, hitting the personal-profile platform average (3.85%) places you significantly above peers. Your benchmark is the median post in your industry, and your goal is to sit two tiers above it.
What drives the top 4% (the EXCEPTIONAL tier)
The 504 posts in the EXCEPTIONAL tier hit a 29.17% engagement rate, 6.32 times the baseline. We pattern-matched what they share. Three things stand out.
They use stat or story hooks, not direct hooks. 77.76% of posts in our corpus open with a "direct" hook (just stating the topic). Stat hooks deliver a 1.67x engagement lift and story hooks deliver 1.51x, while direct hooks deliver only 1.45x. The most-used hook type is the third-most-effective.
They land in the 900 to 1,300 character sweet spot. Posts in this range hit a 3.07% viral rate (vs 2.18% baseline). Long-form posts above 2,500 characters perform reasonably (2.23%), but posts under 300 characters collapse to 1.46%. The EXCEPTIONAL tier skews heavily toward 900-1,300 characters: enough substance to dwell on without exhausting attention.
They use specific viral skeletons. When we cluster the EXCEPTIONAL tier by post structure, a small set of templates dominates. The top performers by engagement lift:
- "Feature Deep-Dive Guide" at 4.58x baseline
- "Identity Pivot Narrative" at 3.48x
- "Full-Circle Reflection" at 3.30x
- "Credibility Cheat Sheet" at 2.88x
These are not random formats. They are repeatable structures that combine a strong hook, a substantive middle, and a comment-bait CTA. If you want to reverse-engineer what is working without copying anyone's voice, our viral score checker grades any draft against these patterns before you publish.
For the underlying algorithm shifts that explain why these formats outperform, see our companion piece on the LinkedIn algorithm in 2026.
How to actually measure your own engagement rate
The formula is simple. The hard part is picking the version you can actually run.
If you have analytics access (your own posts, or a creator who shares their dashboard)
Step 1: Pull impressions and engagements per post. LinkedIn shows impressions in each post's analytics view 24 hours after publishing. Engagements include reactions, comments, and shares.
Step 2: Calculate per-post engagement rate.
(reactions + comments + shares) / impressions × 100
This is the number you compare to Socialinsider's 3.85% platform average and the 4 to 6% "good" range.
If you only have public data (any creator, no analytics access)
Step 1: Pull likes, comments, and shares from the post. These counts are visible on public LinkedIn pages. Tools like ViralBrain do this at scale.
Step 2: Pull the author's follower count at the time of posting.
Step 3: Calculate the follower-based engagement rate.
(likes + comments + shares) / author followers × 100
Numbers from this formula run higher than the impression-based version because followers are a smaller denominator than impressions on a viral post. Use it for relative comparisons across posts and creators. Do not compare it to industry benchmarks built on impressions.
Step 3: Average across the last 30 days. Single posts are noisy. A 30-day rolling average is the most useful number to track.
Step 4: Compare to two benchmarks. The platform average for your account type (3.85% personal, 2.1% company), and the tier table above. Anything above 4.51% (HIGH tier) is genuinely good performance.
Step 5: Track comment-to-reaction ratio separately. A post with 100 reactions and 30 comments (3:1 ratio) signals much stronger algorithmic value than 100 reactions and 3 comments (33:1). The ratio is a better leading indicator of distribution than raw engagement rate.
If you want to skip the spreadsheet, our engagement benchmarks tool computes your rate against the tier system automatically, and our post preview tool lets you draft and visualize a post the way it will render in feed before you publish.
Average LinkedIn follower growth rate 2026
Engagement rate is the post-level metric. Follower growth is the account-level metric. The two move together but on different timescales.
A healthy personal profile that posts 3 to 5 times a week and consistently hits the HIGH tier (above 4% engagement) typically grows followers at 2 to 5% per month in 2026. That is the rate where compounding starts to matter: a creator at 5,000 followers growing 3% per month doubles in 24 months.
A few quick benchmarks:
- Slow but healthy: 1 to 2% monthly follower growth. Posting consistently, mostly in the AVERAGE tier
- Solid: 2 to 5% monthly. Posting consistently, mostly in the ABOVE_AVG and HIGH tiers
- Fast: 5 to 15% monthly. Mix of HIGH and EXCEPTIONAL tier posts, often a viral post once or twice a quarter
- Hypergrowth: 15%+ monthly. Driven by repeated EXCEPTIONAL posts, usually with a niche they own
Follower growth lags engagement rate by 30 to 60 days. If your engagement rate jumps in May, expect follower velocity to pick up in late June or July. If you are seeing high engagement but flat follower growth after 60 days, the issue is usually a weak profile (headline, banner, about section) that does not convert curious readers into followers.
What this means for your content strategy
A few practical moves come out of this data.
- Stop benchmarking against the AVERAGE tier. Most creators target the platform average (3.85%) and feel fine when they hit it. Target the HIGH tier (4.51%+) instead. That is where the top 12% of posts sit.
- Audit your last 10 posts by tier. Pull each post's engagement rate and bucket it. If 5+ are in AVERAGE or BELOW_AVG, the issue is structural (hook type, length, format, CTA), not effort.
- Test one new format per week. Document posts (PDFs, often called carousels) run roughly 7x the engagement of text-only posts. If you are running 100% text-only, adding one document post per week is the highest-leverage change you can make.
- Track comment-to-reaction ratio, not just total engagement. A 3:1 ratio is a leading indicator of HIGH and EXCEPTIONAL distribution. A 30:1 ratio is a sign the algorithm is testing the post and it is not landing.
- Use the tier system as a quality bar. Before publishing, our viral score checker scores drafts against the EXCEPTIONAL tier patterns so you know whether a post has the structural ingredients to land before it goes live.
For the post-structure side of this (hook formulas, length curves, CTA patterns), our companion piece on how to write a LinkedIn post that gets noticed walks through the patterns the EXCEPTIONAL tier uses.
Sources: Socialinsider LinkedIn benchmarks, Meet Lea industry benchmarks, Meet Lea engagement metrics, Grow with Ghost 2026 data, Linklulu engagement rate guide, Linkboost 2026 benchmarks. Proprietary data: ViralBrain analysis of 14,095 LinkedIn posts across 968 active hero creators, snapshot May 2026.
FAQ
What is a good LinkedIn engagement rate in 2026?
A good LinkedIn engagement rate in 2026 is between 4% and 6% for personal profiles and 2% to 3% for company pages. Anything above 6% is excellent, and 10%+ is exceptional. The platform-wide average for personal profiles is 3.85% (Socialinsider, Q1 2026).
What are impressions on LinkedIn?
Impressions are the number of times your post appears on someone's screen, whether or not they engage with it. Impressions count every appearance, so the same person can generate multiple impressions across multiple sessions. Reach is the related metric that counts unique viewers. LinkedIn shows post impressions in the analytics view 24 hours after publishing.
What is the average LinkedIn engagement rate for B2B?
B2B engagement averages run between 2% and 4% depending on industry. Marketing and advertising sit highest (around 4.8%), while financial services and healthcare run lower (2.2 to 2.6%). For B2B founders publishing from personal profiles, hitting 4%+ consistently puts you above the global personal-profile average.
Why did my LinkedIn engagement drop in 2026?
The most common cause is the algorithm shift from social-graph to interest-graph distribution. Posts that used to reach your network now have to compete against the entire interest pool, and impressions have dropped 63 to 66% since 2023 across the platform. Engagement rate per post is up 12 to 39% in compensation, but raw impression and engagement counts can still feel lower. Format mix matters more than ever: text-only posts average 0.90% while document posts (often called carousels) run roughly 7%.
Do views count as engagement on LinkedIn?
No. Views (impressions) are the denominator in the engagement rate formula, not the numerator. Engagement counts reactions, comments, shares, and clicks. A post with 50,000 impressions and 100 reactions has a 0.2% engagement rate, which is in the BELOW_AVG tier.
Is a 10% engagement rate good on LinkedIn?
A 10% engagement rate is exceptional, hit by roughly the top 4% of posts in our 14,095-post dataset. The EXCEPTIONAL tier averages 29.17%, which is 6.32 times the baseline. Sustaining 10%+ across multiple posts (not just one viral hit) puts you in the top fraction of creators on the platform.
What is the average LinkedIn follower growth rate?
Healthy personal profiles posting 3 to 5 times a week and averaging the HIGH tier (4%+ engagement) grow at roughly 2 to 5% per month in 2026. Sub-1% monthly growth usually means inconsistent posting or content stuck in the AVERAGE tier. Above 5% monthly growth signals at least one EXCEPTIONAL post per month plus a converting profile.
How can I track my LinkedIn engagement rate automatically?
Pull impressions and engagement counts from each post's analytics view (available 24 hours after publishing) and average across a 30-day rolling window. To skip the spreadsheet, ViralBrain's engagement benchmarks tool computes your rate against the 5-tier system automatically. A free trial of the full ViralBrain platform is available on the pricing page if you want benchmarks plus content generation in one workspace.
Are LinkedIn engagement rates higher than other platforms?
Yes, by a significant margin. LinkedIn's 3.85% personal-profile average is roughly 2 to 3 times the rates seen on Instagram (1 to 2%) or Twitter/X (under 1%). The reason is structural: LinkedIn's interest-graph algorithm sends content to a smaller, more relevant audience, which raises engagement per impression even though raw reach is lower. For more on the 2026 distribution model, see ViralBrain's full LinkedIn algorithm breakdown.
Automate your LinkedIn for 30 days
ViralBrain plans, writes, and schedules your LinkedIn content — using official LinkedIn APIs so your account stays safe.
- Official LinkedIn APIs — no risk of ban
- You approve every post before it goes live
- Cancel anytime