
Products
Discover HeroesFind top LinkedIn creators in your niche.Post CreatorAI-powered composer with your tone and style.Trending PostsSee what's going viral on LinkedIn right now.
Use Cases
Repurpose ContentTurn YouTube, blogs, and articles into LinkedIn posts.Carousel GeneratorCreate swipeable LinkedIn carousels with AI.30-Day Auto CalendarPlan and auto-publish a month of posts.LinkedIn MCP ServerPost to LinkedIn from Claude, Codex and OpenClaw.For AgenciesRun your clients' LinkedIn content in one place.
Tools
Text FormatterBold, italic, and Unicode styles for posts.Hashtag GeneratorFind the best hashtags for your content.Engagement CalculatorMeasure your post performance instantly.Hook GeneratorAI hooks that stop the scroll.Post PreviewSee exactly how your post will look.Content CalendarPlan and schedule your LinkedIn content.Browse all 90+ free tools
Resources
Free Tools90+ LinkedIn tools, no signup required.Templates100 ready-to-use LinkedIn post templates.GuidesStep-by-step LinkedIn growth playbooks.CollectionsCurated tool sets by role and goal.CompareViralBrain vs. other LinkedIn tools.BlogLinkedIn growth tips and strategies.
Pricing
LoginStart 7 Days Trial
Back to Discover Heroes
Dylan Arnaud

Dylan Arnaud

LinkedIn Content Strategy & Writing Style

Data Analyst | J’aide les entreprises à piloter leur activité et leur rentabilité en concevant des tableaux de bord sur mesure | Power BI & Fabric | ⭐ 5/5 Malt

France
71 Viral ScoreView on LinkedIn

1 person tracking this creator on ViralBrain

Warm Analysis

Dylan Arnaud positions himself as a high-authority practitioner who bridges the gap between technical data rigor and business profitability. His content strategy centers on "de-risking" the data profession, providing exhaustive, zero-friction resources like SQL cheat sheets and Power BI error guides that move beyond basic tutorials into production-grade methodology. He is notable for his "no-fluff" transparency, offering high-value assets without lead magnets, which builds immense trust with both job seekers and stakeholders. The most compelling intersection in his work is technical mentorship paired with career pragmatism, where he teaches followers not just how to code, but how to "exit the pile" by solving specific business problems rather than simply building pretty dashboards.

Performance Overview

Followers

14.8K

Connections

11.7K

Avg. Engagement

110

Engagement Rate

Posts/Week

4.7

Viral Score

71

Posts Analyzed

4

Top Posts by Engagement

Savoir coder ne représente que 40% du job de Data Analyst. 🛑 Les 60% restants (compréhension, rigueur, communication) sont souvent là où les juniors échouent. On apprend Python et SQL à l'école, ma…

21693239 viral
Data Analytics Career Advice9 months ago
View on LinkedIn

🎯 QCM Technique Data Analyst : Les 6 questions pièges qui éliminent 90% des juniors Ce n'est pas un test de connaissances basiques. C'est un piège à ambiguïtés techniques où la réponse évidente cach…

22453034 viral
Data Analytics Career Advice8 months ago
View on LinkedIn

🚀 57 secrets pour passer de Junior à Lead Data Analyst Après des années à accompagner des équipes data, j'ai compilé les leçons essentielles que j'aurais aimé connaître à mes débuts.​ Pas de théori…

12652523 viral
Data Analytics Career Development7 months ago
View on LinkedIn

🐍 Test Technique Python Data : 20 Questions Essentielles (15 min) Préparez-vous à l'entretien technique Python avec les questions qui tombent réellement. 💻 I. SYNTAXE & BASES Q1. Liste vs Tuple ?…

15822022 viral
Python Interview Prep8 months ago
View on LinkedIn

J'ai créé un QCM de 20 questions Python pour tester votre niveau avant un entretien Data Analyst. Syntaxe, Pandas, NumPy, statistiques. Corrigé et expliqué. Python s'est imposé comme le standard inc…

15571722 viral
Data Analytics Interview Prep7 months ago
View on LinkedIn

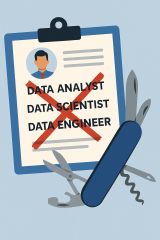
Arrêtez de mettre "Data Analyst / Scientist / Engineer" sur votre CV 🛑 C'est l'erreur n°1 que je vois chez les juniors : vouloir être le "Couteau Suisse" de la Data Vous apprenez Python, SQL, le Cl…

LinkedIn post image: Arrêtez de mettre "Data Analyst / Scientist / Engineer" sur votre CV 🛑
15319521 viral
Career Advice9 months ago
View on LinkedIn

Posting Patterns & Frequency

4.7 posts/week

Posts / Week

1.7 days

Days Between Posts

4

Total Posts Analyzed

HIGH

Posting Frequency

Timezone: Europe/Paris

Best Performing Days

SundayMondayFriday

Best Performing Times To Post

17:0011:00

Topics & Content Focus

Primary Topics

Power BI mastery beyond charts (data modeling, DAX, Power Query, performance/VertiPaq)Interview-readiness for Data roles via skill diagnostics (QCMs, senior-vs-junior differentiators)SQL & Python fundamentals that signal real seniority (logic, performance, anti-patterns)

Secondary Themes

“Common mistakes” learning model (error → consequence → best practice)Analytics career acceleration (portfolio-first proof, business impact positioning)BI storytelling/UX as a decision-making tool (not decoration)

Industry Focus

Business Intelligence & Analytics (Power BI ecosystem)Data Analyst hiring/interview evaluationApplied data skills for business teams (finance/RH/sales reporting use-cases)

Content Categories

Skill assessments (quizzes with corrections)Technical playbooks & checklists (top errors, rules of thumb)Free resource drops (guides/attachments, no gating)Career positioning content (portfolio, LinkedIn narrative)

Performance Insights

109.5%

Avg Engagement Rate

STABLE

Performance Trend

Best Performing Topics

Interview QCMs and level diagnostics (Python/Power BI) with corrected explanationsClear seniority signals & “what recruiters really test” framingActionable micro-concepts that expose depth (performance pitfalls, context/filter logic)

Virality Signals

Shareable utilities (tests, guides) that audiences forward to peersClear “status ladder” mechanics (junior vs senior) that prompt comparison and sharingMemorable “separating questions” (.loc vs .iloc, CALCULATE vs FILTER) that spark discussion

Structure & Quality

1600

Avg Length (Words)

HIGH

Depth Level

ADVANCED

Expertise Level

0.78/10

Uniqueness Score

Common Hooks

Asset-first hook ("J'ai créé / J'ai condensé" + ressource immédiatement actionnable)Seniority framing ("junior → senior" / "sortir du lot")Error/anti-pattern hook ("Top erreurs", "piège", "à éviter")Recruiter-reality hook ("ce que l'entretien teste vraiment")

Common Endings

Signature question that invites self-assessment ("Quelle différence entre X et Y ?")Share/forward prompt ("si vous connaissez quelqu'un...")Reframe of the job’s purpose (decisions/actionnables vs. beauté des graphes)

Value Delivery Methods

Compresses complex tooling into decision-ready heuristics (rules, pitfalls, best practices)Teaches mental models (declarative SQL execution order, filter/context reasoning)Turns learning into proof artifacts (portfolio projects, public documentation)Focuses on under-the-hood competence (performance, modeling, engine behavior)

Formatting Style

Skimmable pedagogy: numbered pillars + bullet listsEmoji as section markers (1️⃣, 📊, 💡) to guide reading flowConcept → example → rule (e.g., execution order in SQL, .loc vs .iloc)High density of concrete keywords/tools (DAX Studio, Tabular Editor, Query Folding, Parquet)

Audience & Tone

YES

Question Usage

0.6%

Response Rate

Detected Tone

Authoritative coachPragmatic and no-fluffSenior practitioner translating complexity into simple rulesRecruiter-aware (aligned with evaluation criteria)semi-formalfirst-person

Interaction Style

Challenge-based engagement (self-test questions, scoring benchmarks)Peer-to-peer distribution (encourages sharing with learners/interviewees)Practical troubleshooting orientation (audience comes for fixes and guardrails)

Community Building Signals

Creates repeatable series formats (QCMs, error lists) that build returning readershipPositions content as a public training path (learn → test → portfolio → seniority)Uses inclusive coaching language aimed at learners and job-seekers

Writing Style Patterns

Content Strategy

Hook: Asset-first hook ("J'ai créé / J'ai condensé" + ressource imTone: semi-formalCTA: Download/use-now CTA (piece jointe, gratuit, sans

Writing style breakdown

<start of post>

Le piège du "toujours plus" en Data Viz.

On pense souvent qu'un bon dashboard est un dashboard rempli. Plus de filtres, plus de couleurs, plus de graphiques complexes.

C'est l'erreur n°1 qui tue l'adoption de vos outils.

La réalité : un décideur a 5 secondes pour comprendre. S'il doit chercher l'information, vous avez déjà perdu son attention.

Voici les 3 règles pour épurer vos rapports Power BI

1️⃣ La règle du "Data-Ink Ratio"

Supprimez tout ce qui n'est pas de la donnée. Bordures inutiles, fonds colorés, quadrillages sombres. La donnée doit être la star, pas le contenant.

2️⃣ La hiérarchie visuelle (Z-Pattern)

L'œil lit en "Z". Placez le KPI le plus important en haut à gauche. Les détails et les graphiques d'évolution viennent ensuite. Le bouton de reset des filtres ? En bas ou totalement intégré.

3️⃣ Le test du "Et alors ?"

Pour chaque visuel, posez-vous la question : "Si ce chiffre baisse de 10%, quelle action le business prend-il ?". Si la réponse est "aucune", supprimez le graphique.

📊 Le résultat d'un dashboard épuré

Moins de questions de support

Des décisions prises plus rapidement

Une image de Senior Analyst qui comprend le business

💡 Mon conseil : commencez par une page blanche et n'ajoutez que le strict nécessaire. Il est plus facile d'ajouter un filtre plus tard que de simplifier un monstre devenu illisible.

La perfection est atteinte, non pas lorsqu'il n'y a plus rien à ajouter, mais lorsqu'il n'y a plus rien à retirer.

Le guide complet sur l'UX en Data est disponible en commentaire.

<end of post>

1. OVERALL WRITING STYLE & VOICE
2. STRUCTURAL FLOW & LOGICAL PROGRESSION
3. SPACING, LINE BREAKS & VISUAL FLOW

Sign in to unlock the full writing analysis

Apply Dylan Arnaud's patterns to your posts

Free tools to help you write, score, and benchmark in the same style.

LinkedIn Hook Generator

Generate scroll-stopping hooks in the same style top creators use.

Open tool

LinkedIn Post Scorer

Score your draft against viral post patterns before you publish.

Open tool

LinkedIn Engagement Calculator

Benchmark your engagement rate against creators in your niche.

Open tool

More LinkedIn creators to learn from

Discover all

Other creators worth studying alongside Dylan Arnaud.

Pierre-Eliott Lallemant

Pierre-Eliott Lallemant

Co-Founder & CEO at GojiberryAI (YC P26) - We build AI Agents that find and book meetings with your next customers

Arianna Huffington

Arianna Huffington

Founder and CEO at Thrive Global | Passionate about Health and AI

Gérôme Grignon

Gérôme Grignon

Angular Can I Use creator | Frontend Software Engineer @Lucca | Angular Devs France Founder

Imran M.

Imran M.

Investing @ Alif | Co-Founder @ Kayyo

Ankur Nagpal 💰

Ankur Nagpal 💰

GP @ USVC. Founder of Carry (sold to Angellist) and Teachable (sold to Hotmart).

Steven Phuc

Steven Phuc

Software Developer

€1 trial · 7 days

Automate your LinkedIn for 30 days

ViralBrain plans, writes, and schedules your LinkedIn content, using official LinkedIn APIs so your account stays safe.

  • Official LinkedIn APIs, no risk of ban
  • You approve every post before it goes live
  • Cancel anytime
Start €1 trial€39 Pro or €69 Premium · cancel anytime

30-day plan

On track
1
2
3
4
5
6
7
8
9
10
11
12
13
14
15
16
17
18
19
20
21
22
23
24
25
26
27
28
13 posts queued · auto-publishing
€1 · 7-day trial

Write like Dylan Arnaud and auto-post for 30 days.

ViralBrain learns their voice and publishes for you.

Try it free

Write like Dylan Arnaud.

Try it free

Discover more LinkedIn creators · ViralBrain

Other LinkedIn creators

  • Alok Jethanandani
  • Monica Khan
  • Brittany Hennessy
  • Ray Dalio
  • Carly Taylor
  • Megan Lieu
  • Stanley Obidiegwu
  • Dr. Vee Kativhu
  • EOTI
  • Luciano Santos
  • Ravindu Deshan
  • Akhila G
  • Hannah Weng