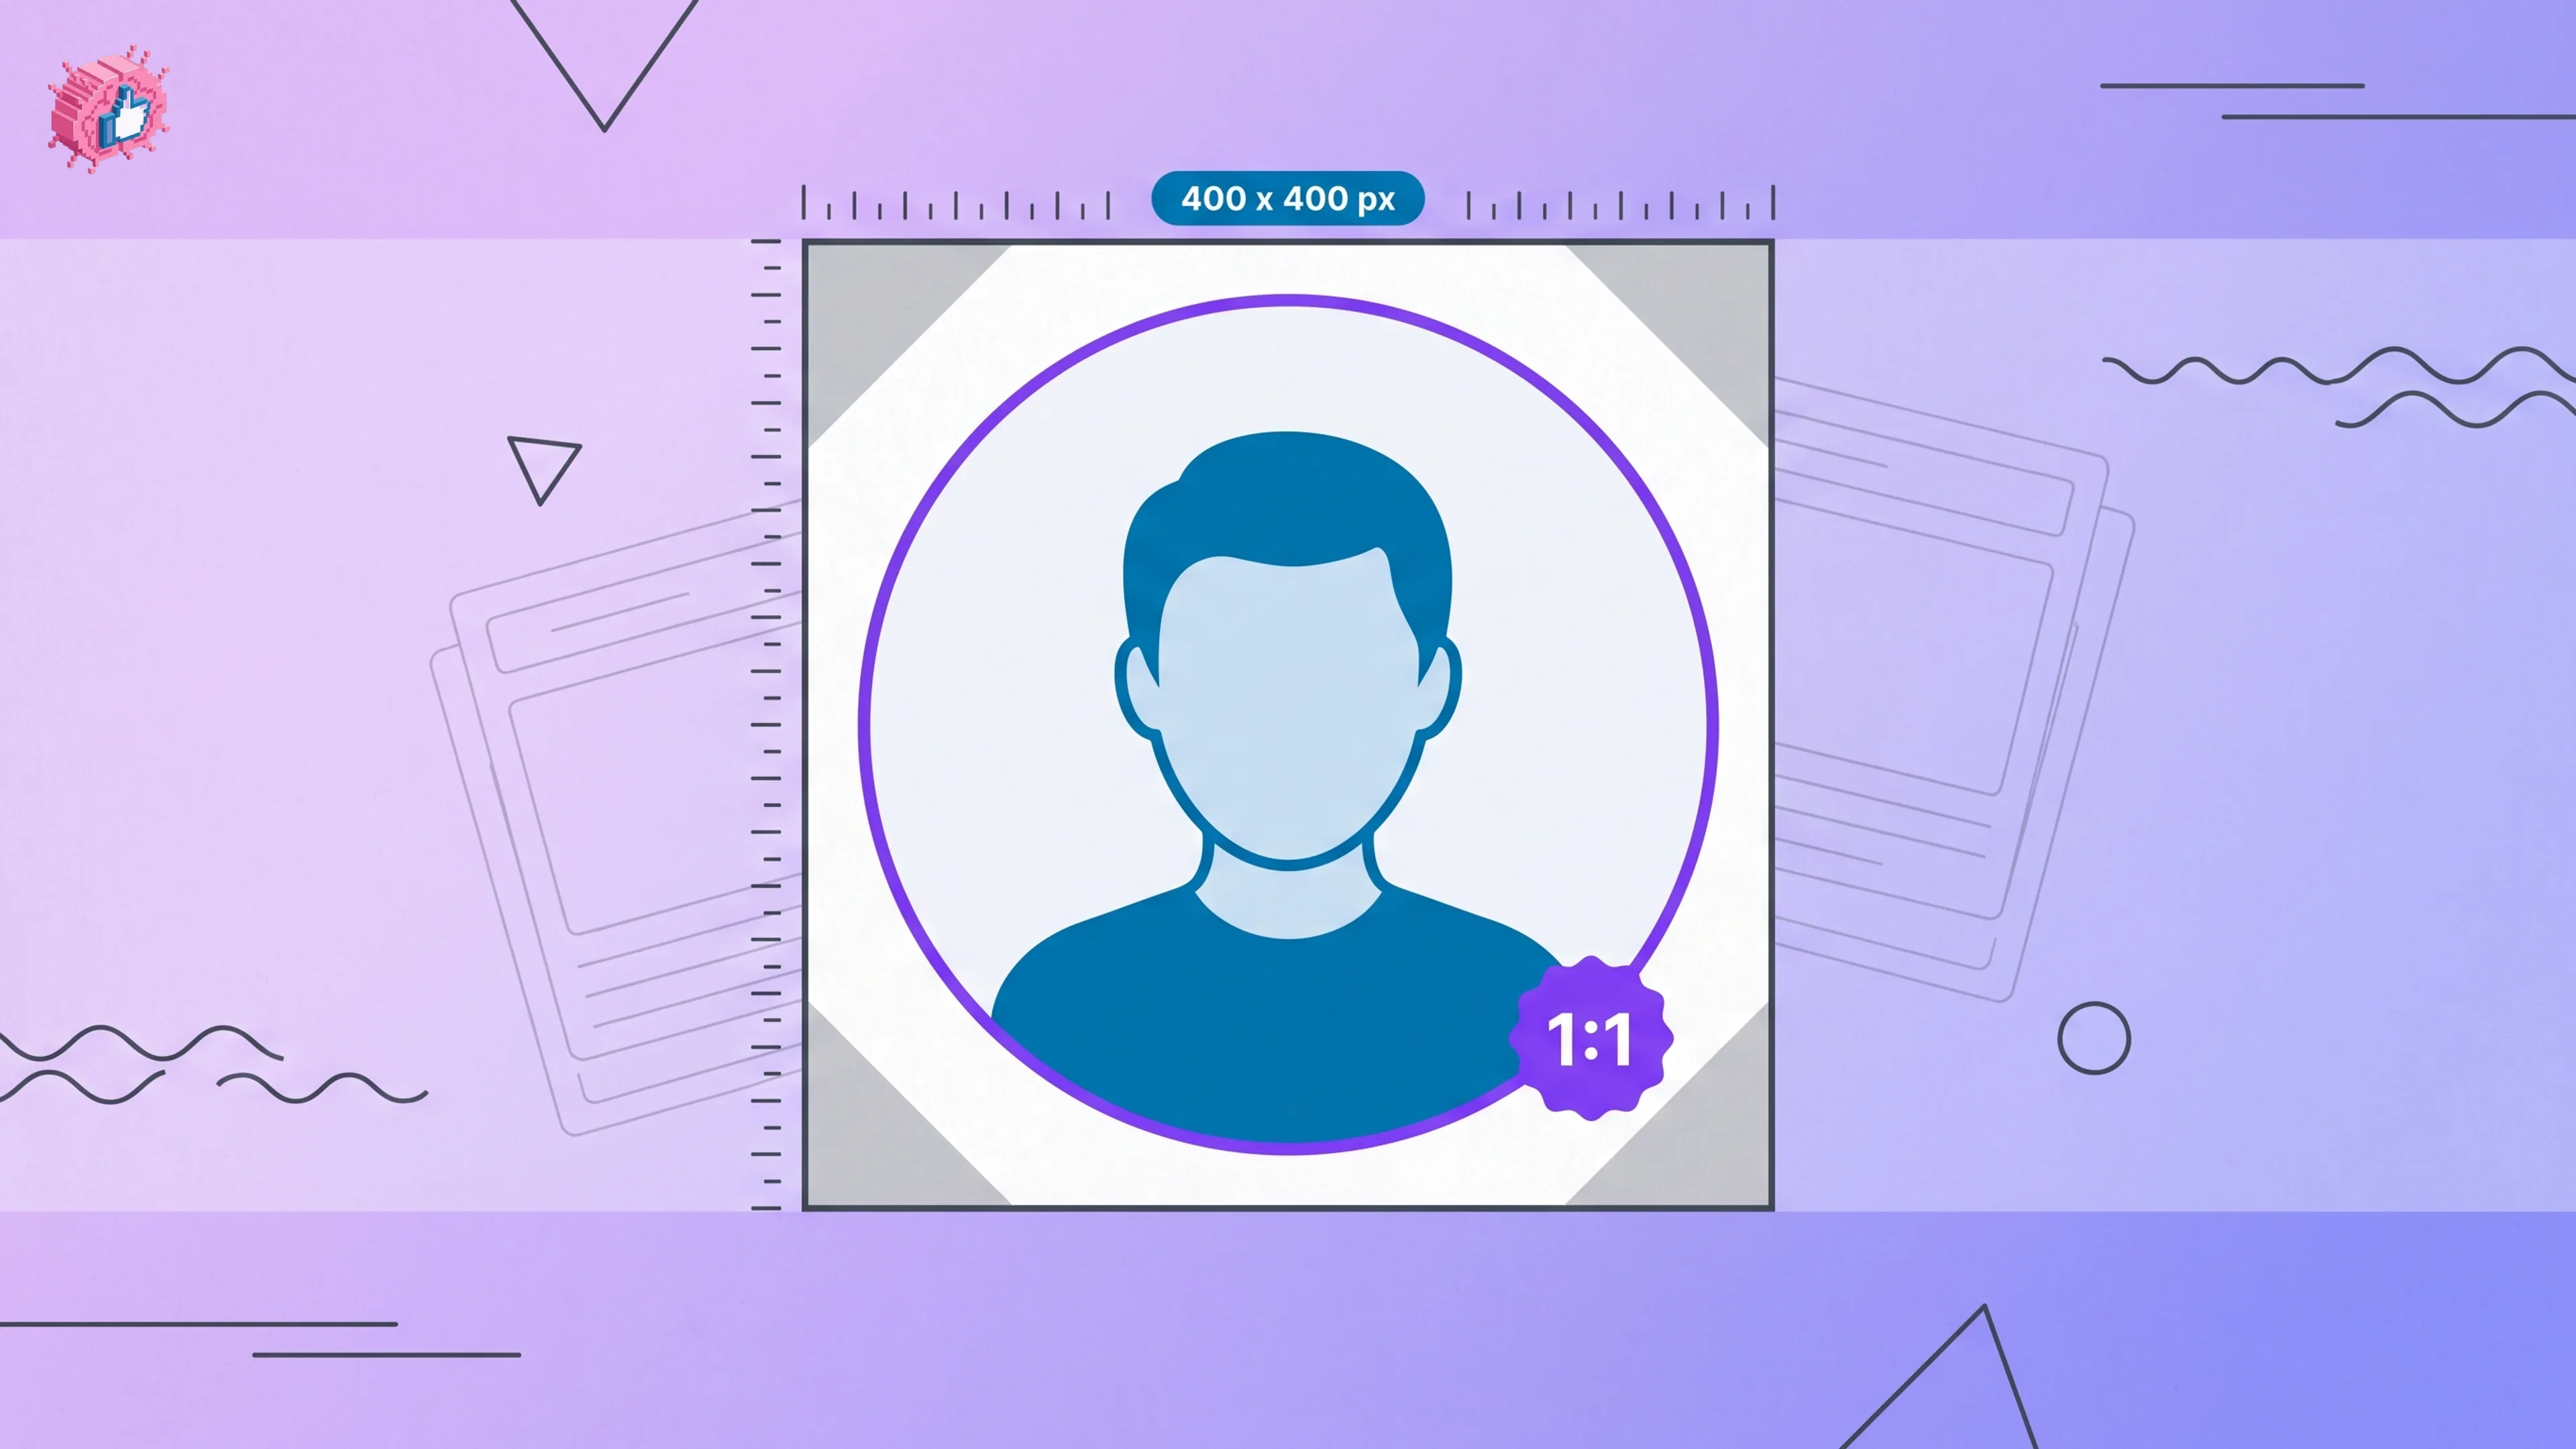
Back to Blog
Roundup

We Analyzed 10,000+ LinkedIn Posts. Here's What Actually Goes Viral.

·Listicle

We analyzed 10,222 LinkedIn posts from 494 creators. Only 2.16% went viral. The median post gets 40 likes. Here's every data point we found on what separates the top 1% from everyone else, broken down by format, length, timing and topic.

linkedin data analysislinkedin statisticscontent analysislinkedin benchmarkssocial media datalinkedin insights

We built a database of 10,222 LinkedIn posts from 494 creators. Every post tracked for likes, comments, shares, engagement rate, format, length, topic category and publishing day.

We did this because most LinkedIn advice is vibes. "Post consistently." "Add value." "Engage with your community." All technically true. None of it specific enough to act on. You could follow all three pieces of advice and still have no idea why your posts are getting 23 likes while someone in your industry is getting 2,300.

We wanted numbers. Real ones. Here's everything we found.

The Brutal Truth: Only 2.16% Go Viral

Out of 10,222 posts, 221 went viral. That's 2.16%.

Put differently: for every viral post, there are 45 that didn't break through. If you post three times a week, you'll go viral roughly once every four months. Statistically. You could have a perfect strategy, excellent content and a growing audience, and you'd still go months between viral posts. That's not a failure. That's math.

This isn't a failure rate. This is normal. The most prolific creators in our dataset still only go viral on a small percentage of their posts. Virality isn't a skill you can master. It's a probability you can improve.

If anyone tells you they have a formula for guaranteed viral posts, they're either selling something or they posted once, went viral and assumed it was skill rather than luck. Usually both.

Pro tip: Think of viral posts like home runs in baseball. Even the best hitters only connect on a fraction of their at-bats. The strategy isn't to engineer home runs. It's to get more at-bats (post more) and improve your batting average (write better). The home runs come as a byproduct.

The Median vs. The Average: Two Very Different Stories

The median post: 40 likes, 8 comments.

The average post: 288 likes, 52 comments.

That's a 7x gap. Why?

Because averages lie when the distribution is skewed. A single post with 11,576 likes pulls the average up for thousands of posts that got 20 likes. The average is technically correct. It's also completely useless as a benchmark. It's like saying the average person has $4.7 million in net worth because Jeff Bezos is in the sample.

If you're getting 40 likes and 8 comments per post, you are exactly average. Normal. Typical. You are not failing. You're performing at the median. This is probably the most reassuring thing in this entire article, so let it sink in.

Most people don't know this because LinkedIn only shows you the outliers. Your feed is curated to surface the best-performing content. You never see the 9,000+ posts in our dataset that got fewer than 288 likes. But they exist. You're probably writing them. That's fine. So is almost everyone else.

The real question isn't "why am I not going viral?" It's "how do I move my median from 40 to 80 to 150?" That's an achievable, measurable goal. Going from 40 to 80 doubles your engagement. Going from 40 to 4,000 requires lightning to strike. Focus on doubling, not on lightning.

Pro tip: Stop comparing yourself to the creators you see in your feed. Your feed is literally an algorithm-curated highlight reel. It's like comparing your behind-the-scenes to everyone else's greatest hits. Compare yourself to the median (40 likes). If you're consistently above that, you're winning.

The Full Distribution

PercentileLikesWhat It Means
Median (P50)40Half of all posts perform below this
P75~150Top 25%
P90573Top 10%
P95~1,500Top 5%
P993,959Top 1%
PercentileComments
Median (P50)8
P90~100
P99649

To reach the top 10%, you need 573+ likes. To reach the top 1%, you need 3,959+. The gap between "good" and "exceptional" is enormous. Moving from 40 to 573 likes is a 14x improvement. Moving from 573 to 3,959 is another 7x on top of that.

This matters for goal-setting. If you're at 40 likes per post, aim for 100. Not 3,000. Incremental improvement is the real game. The jump from P50 to P75 is achievable with better hooks, images and timing. The jump from P75 to P99 requires all of that plus a growing network, consistent output over months and a healthy dose of luck.

Pro tip: Print out this percentile table (or screenshot it) and keep it somewhere visible. It's the most honest benchmark you'll find for LinkedIn performance. Every time you feel discouraged about a post's performance, check where it falls on this distribution. Getting 150 likes? You're in the top 25%. That's legitimately good. Act accordingly.

Format Matters. A Lot.

This is one of the clearest signals in the entire dataset. If there's one thing you take away from this article, let it be this: your choice of format is probably the biggest lever you have.

Image Posts (Including Carousels)

  • Average likes: 468
  • Average comments: 85
  • Engagement rate: 0.93%
  • Viral posts: 142

Text Posts

  • Average likes: 191
  • Average comments: 33
  • Engagement rate: 0.50%
  • Viral posts: 79

Poll Posts

  • Average likes: 25
  • Average comments: 23
  • Engagement rate: 0.07%
  • Viral posts: negligible

Image posts get 2.45x more likes, 2.6x more comments and an 87% higher engagement rate than text. They went viral nearly twice as often despite text posts being more common in our dataset.

The reason is dwell time. Images and carousels stop the scroll. They increase the time someone spends looking at your post. LinkedIn's algorithm treats dwell time as its primary quality signal. More dwell time = more distribution. A text post, no matter how brilliant, can be skimmed in two seconds. An image forces the viewer to pause. A carousel forces them to swipe. Both actions tell the algorithm: this person is interested.

Think about your own LinkedIn behavior. When you're scrolling the feed at 8:15am with your coffee, what stops you? It's almost always something visual. An image. A chart. A face. Text posts have to work much harder to earn that pause.

Polls are dead. A 0.07% engagement rate is effectively zero. If you're still posting polls, you're actively hurting your presence. Remember when polls were everywhere in 2021-2022 and every other post was "Which is more important: A) Hard work B) Smart work C) Both"? The audience got tired. The algorithm adjusted. The party is over. Move on.

Pro tip: You don't need to be a graphic designer to use images. A screenshot of a dashboard, a photo from a conference, a simple chart made in Google Sheets, a selfie with a caption: all of these count as "image posts" and get the engagement boost. The bar is lower than you think.

Pro tip: If you do have design skills (or access to a tool like Canva), carousels are the format with the highest dwell time. A 10-slide carousel where someone swipes through every slide generates enormous dwell time signals. This is the format most likely to produce viral results.

The Length Sweet Spot

LengthEngagement RateAvg LikesAvg Comments
Short (under 500 chars)0.48%37635
Medium (500-1,200 chars)0.83%----
Long (1,200-2,000 chars)0.77%222--
Very Long (2,000-3,000 chars)0.66%35274

Medium-length posts (500-1,200 characters) win on engagement rate at 0.83%. That's roughly 100-200 words. Enough to make a point. Not enough to lose anyone. It's the Goldilocks zone: long enough to say something meaningful, short enough that people actually finish reading.

Short posts (under 500 characters) are interesting. They get high average likes (376) but a low engagement rate (0.48%). People like them quickly but don't comment. Easy to consume, easy to react to, easy to forget. They're the candy of LinkedIn: a quick sugar hit, no lasting nutrition.

Very long posts (2,000-3,000 characters) generate the most comments at 74 per post average. They create deeper engagement. If your goal is conversation rather than maximum reach, longer works. Long posts tend to attract the kind of person who has something to say, which makes sense. If someone reads all 3,000 characters of your post, they're invested enough to leave a comment. Casual scrollers have already moved on.

Pro tip: There's a strategic way to think about length. Use short posts for simple, punchy observations that you want maximum likes on. Use medium posts for your core content. Use long posts when you want to spark a serious discussion in the comments. Match the length to your objective, not to some arbitrary rule.

The counterintuitive data point: the two most-liked short posts in our dataset were almost absurdly brief. "I can retire now" (16 characters) got 2,415 likes. "Classic" with a laughing emoji (9 characters) got 2,965 likes. These are outliers that prove length rules aren't absolute. Sometimes the shortest possible post outperforms everything else. But both of these were paired with images, which likely did a lot of the heavy lifting.

The honest truth: if you're not already famous on LinkedIn, a 9-character post probably won't work for you. Context matters. When someone with 500,000 followers posts "Classic" with a laughing emoji, their audience fills in the meaning. When someone with 500 followers does the same thing, it just looks like an accident.

But for most creators, most of the time: 500-1,200 characters is the target. Write to that range and you're already optimizing for the highest engagement rate in our data.

When to Post

DayEngagement RateAvg LikesAvg Comments
Tuesday0.92%----
Monday0.72%----
Thursday0.71%----
Friday0.69%----
Wednesday0.65%326--
Sunday0.55%37769
Saturday0.46%----

Tuesday is the best day by a clear margin. 0.92% engagement rate. If you're only posting once a week, make it Tuesday. If you're only posting twice, make it Tuesday and Thursday. The data is very clear on this.

Saturday is the worst day. 0.46%. Don't waste your best content on Saturday. Save Saturday for when you accidentally write a post that's not that good and you want to bury it. (That's a joke. Mostly.)

Sunday is the counterintuitive winner for raw numbers. 377 average likes, 69 average comments. Both the highest of any day. The explanation: fewer people post on Sunday, so less competition per post. But the total audience is smaller, which drags the rate down.

If you're testing experimental content, Sunday is a good lab. Low competition means decent visibility even if the content isn't your strongest. Think of Sunday as the LinkedIn equivalent of a soft opening for a restaurant. Lower stakes, smaller crowd, good for testing new dishes.

Pro tip: The time of day matters too, though less than the day of week. Generally, posting between 7-9am in your primary audience's timezone gives you the best shot at catching the morning scroll. But don't obsess over posting at exactly 8:07am or whatever your favorite LinkedIn guru recommends. The window is wide. Anywhere in the morning works.

Pro tip: If your audience is global, pick the timezone of your largest concentration of connections. If 60% of your network is in US Eastern time, post at 8am ET even if you're in London. You can always schedule posts in advance to hit the right window.

What Topics Work

This is where the data gets really interesting. And where most generic LinkedIn advice falls apart.

By Volume (Most Posts)

CategoryPostsAvg LikesEngagement Rate
AI1,223339--
Marketing352----
Career Advice230588--
Leadership216710--
Entrepreneurship1746361.00%

By Engagement Rate (Best Performing)

CategoryEngagement RateNotes
Software Engineering2.57%Small but passionate audience
Social Media Marketing1.34%210 avg comments (most discussed)
AI Automation1.08%--
Sales1.01%--

By Raw Engagement (Most Liked)

CategoryAvg LikesAvg Comments
Personal Development1,222--
Leadership710--
Entrepreneurship636123
Career Advice588--
AI33987

Three distinct stories emerge from the topic data.

If you want the highest engagement rate: write about niche professional topics. Software Engineering at 2.57% and Sales at 1.01% drastically outperform broader categories. Niche audiences are more engaged per capita. When a software engineer writes about a specific technical problem, every other engineer who sees it feels compelled to weigh in. It's their turf. They have opinions. The comments flow naturally.

If you want the most raw engagement: personal topics dominate. Personal Development at 1,222 average likes beats everything else by a wide margin. Leadership, Entrepreneurship and Career Advice all generate 500+ average likes. People react to human stories. A vulnerable post about career struggles or personal growth resonates with a much wider audience than a post about JavaScript frameworks. The trade-off: the engagement rate is lower because the audience is broader and less targeted.

If you want conversation: Social Media Marketing gets 210 comments per post on average. Entrepreneurship gets 123. These categories spark debate because the audience is opinionated and active. Social media marketers are literally professional engagers. They comment for a living. Writing about social media marketing to an audience of social media marketers is like performing for an audience of performers. They can't help themselves.

Pro tip: Look at this topic data through the lens of your actual goals. If you're trying to get clients for your software engineering consultancy, a 2.57% engagement rate with your target audience is far more valuable than 1,222 average likes from people who will never hire you. Raw likes look impressive. Niche engagement generates business.

The winning strategy for most creators: combine niche expertise with personal narrative. Write about your specific professional domain, but frame it through personal experience. You get the engagement rate of niche content with the raw reach of personal stories. "How I reduced deployment time by 80% (and what it cost me personally)" combines a technical insight with a human story. That's the sweet spot.

What the Top Viral Posts Have in Common

We looked at every viral post in our dataset (221 total). Patterns emerged. Not formulas: patterns. The distinction matters. You can follow these patterns and improve your odds. You cannot follow them and guarantee results.

Personal Stories Dominate

The posts with the highest engagement are almost always personal. Family moments tied to career journeys. Vulnerable reflections about failure. Emotional milestones. One family-related personal story hit 6,781 likes.

These posts work because they feel real in a sea of polished professional content. LinkedIn has a particular culture of performative professionalism where everything is an achievement, every setback is a learning opportunity and every Monday is an exciting start to a productive week. When someone breaks that pattern with genuine emotion, it's like opening a window in a stuffy room. People notice.

The counterpoint: not all personal stories go viral. The ones that do typically connect the personal moment to a broader professional insight. "My dad taught me this about business" works because it bridges the personal and the professional. "Here's what I had for breakfast" doesn't work because it's just personal.

Pro tip: The personal stories that perform best have a specific moment, not a general reflection. "The phone call where I found out we lost the client" is more engaging than "Dealing with client churn is tough." Put the reader in the scene. Make them feel what you felt.

Funding and Milestone Announcements

"Lovable just raised $330M" got 11,576 likes. The highest in our entire dataset. Funding announcements have built-in social proof and activate network effects: colleagues, investors, employees all pile in to congratulate and amplify. It's one of the few post types where the engagement is partially obligatory. If your portfolio company raises $330M, you're going to like that post.

If you don't have funding news, milestone posts (revenue targets, team size, customer counts) create a similar effect on a smaller scale. "We just crossed 1,000 customers" or "Our team hit 50 people today" gives your network a reason to celebrate with you.

Pro tip: Milestone posts work best when they include the backstory. "We crossed $1M ARR" is good. "We crossed $1M ARR, 18 months after nearly shutting down" is much better. The contrast between struggle and success is what makes people feel something.

Bold Industry Predictions

"I'm calling it right now" got 5,465 likes. Predictions are engaging because they're inherently debatable. People agree, disagree, add their own predictions. The comment sections on prediction posts are some of the longest in our data. Everyone wants to go on the record.

The key: be specific. "AI will change everything" is boring. Everyone agrees. There's nothing to debate. "AI will eliminate 70% of junior copywriting roles by 2027" is specific enough to debate. Now people have to decide: do they agree with the number? The timeline? The specific roles? Each element is debatable. That's three or four different arguments in one prediction.

Pro tip: The best prediction posts include your reasoning, not just the prediction. "I'm calling it right now: X will happen. Here's why I believe this, based on Y and Z." The prediction gets people in the door. The reasoning keeps them in the comments.

Surprisingly Short Posts

This surprised us. Some of the most viral posts in our dataset were absurdly short.

"I can retire now" (16 characters): 2,415 likes.
"Classic" with a laughing emoji (9 characters): 2,965 likes.

Both were paired with images. The brevity was the point. In a feed full of 2,000-character essays, a two-word post stands out precisely because it breaks the pattern. It's pattern interruption as a content strategy.

This doesn't mean you should only write two-word posts. But it proves that engagement isn't a function of how much you write. It's a function of how strongly someone reacts to what you write. A two-word post that triggers an emotional response will outperform a 2,000-word essay that triggers nothing.

Images Are Over-Represented in Viral Posts

142 viral posts were image posts. 79 were text posts. Text posts outnumber image posts in our overall dataset, yet image posts produced nearly double the viral hits.

If you're optimizing for virality (recognizing it's still only a 2.16% shot), always include an image. This is the single most actionable takeaway in the entire analysis. It's also the easiest to implement. You don't need to write better hooks or choose better topics. You just need to attach an image.

Pro tip: If you're struggling to find an image for every post, create a simple template in Canva or any design tool. A consistent brand template (your colors, your font, a text overlay) takes five minutes to create and can be reused endlessly. Just update the text for each new post.

The Uncomfortable Truth About Virality

Here's what the data really says, if you read it honestly:

You can't engineer virality. You can improve your odds. Post on Tuesday. Use images. Write in the 500-1,200 character range. Pick the right topics. All of this helps. But the difference between a post that gets 200 likes and one that gets 5,000 likes often comes down to timing, luck and network effects you can't control. Someone with 500,000 followers sharing your post into their network has more impact than any optimization you could do. And you can't control whether they share it.

Consistency matters more than optimization. The creators who perform best in our dataset aren't the ones who cracked some secret formula. They're the ones who post regularly. Three to five times per week. Month after month. Volume creates more at-bats. More at-bats mean more chances to hit. The correlation between posting frequency and average performance in our data is stronger than the correlation between any single optimization (format, length, timing) and performance.

Pro tip: If you post three times a week for a year, that's roughly 150 posts. At a 2.16% viral rate, you'd expect about 3 viral posts. If you post five times a week, that's 250 posts and roughly 5 viral hits. The math is simple. More posts, more chances. Don't over-optimize individual posts at the expense of output consistency.

The median creator is invisible. Forty likes and 8 comments means most of your posts are seen by your existing connections and nobody else. That's the reality for the majority of LinkedIn users. The gap between invisible and visible isn't about one tactic. It's about sustained output over months. It's about slowly growing your network, slowly building an audience, slowly establishing yourself as someone worth following. There's no shortcut through that.

The average is a lie. Stop comparing yourself to the 288-like average. Compare yourself to the 40-like median. If you're consistently above 40, you're doing better than half the creators out there. Build from there. Celebrate the small wins. Moved from 40 to 60? That's a 50% improvement. That's real.

What to Do With This Data

The practical takeaways, ranked by impact:

1. Use images or carousels. The 87% engagement advantage is the biggest lever in the data. If you're only posting text, you're leaving the easiest performance gain on the table. This is the change with the highest impact-to-effort ratio. It takes two minutes to add an image. It gives you an 87% boost. Nothing else in our data comes close to that return on effort.

2. Write 500-1,200 characters. Highest engagement rate. Most people write too long. Edit harder. Read your post, find the core insight, cut everything else. If you're at 1,800 characters, you can probably say the same thing in 1,000.

3. Post on Tuesday. 0.92% vs. 0.46% for Saturday. That's a 2x difference for zero extra effort. Just move your best content to Tuesday. That's it.

4. Pick a niche and go deep. Software Engineering at 2.57% engagement rate proves that specific beats general. Find your niche equivalent. What's the narrow professional topic where you have genuine expertise? That's where you'll get the highest engagement rate.

5. Add personal stories to professional content. The top raw engagement comes from personal stories. The top engagement rate comes from professional niches. Combine them. Frame your professional insight through a personal experience. Best of both worlds.

6. Stop using polls. 0.07% engagement rate. They're done. If you have a poll scheduled for next week, delete it. Replace it with literally any other format.

7. Post more. You need roughly 46 posts for one viral hit. The only way to improve your odds is to increase your volume while maintaining quality. Three posts a week is the minimum. Five is better if you can maintain quality.

Pro tip: Don't try to implement all seven changes at once. Start with #1 (add images) because it's the easiest and highest-impact. Then move to #2 (length). Then #3 (timing). Layer them on one at a time over several weeks. You'll see the cumulative effect in your monthly metrics.

8. Recalibrate your expectations. If you're consistently hitting 40+ likes, you're at the median. If you're hitting 150+, you're in the top 25%. If you're hitting 573+, you're in the top 10%. Know where you stand. Measure progress against your own baseline, not against the viral posts in your feed.

The data is clear. The question is whether you'll use it.


Every data point in this article comes from ViralBrain's database of 10,222 LinkedIn posts across 494 creators. ViralBrain gives you access to this data for your own content: real benchmarks, real performance tracking, real insights into what works and what doesn't.